Gold ETFs Add 121 Metric Tons, Faster than Supply Can Respond



August’s $18 billion gold fund inflows increased physical demand, while mine output, costs and permits determine how quickly new supply can follow.
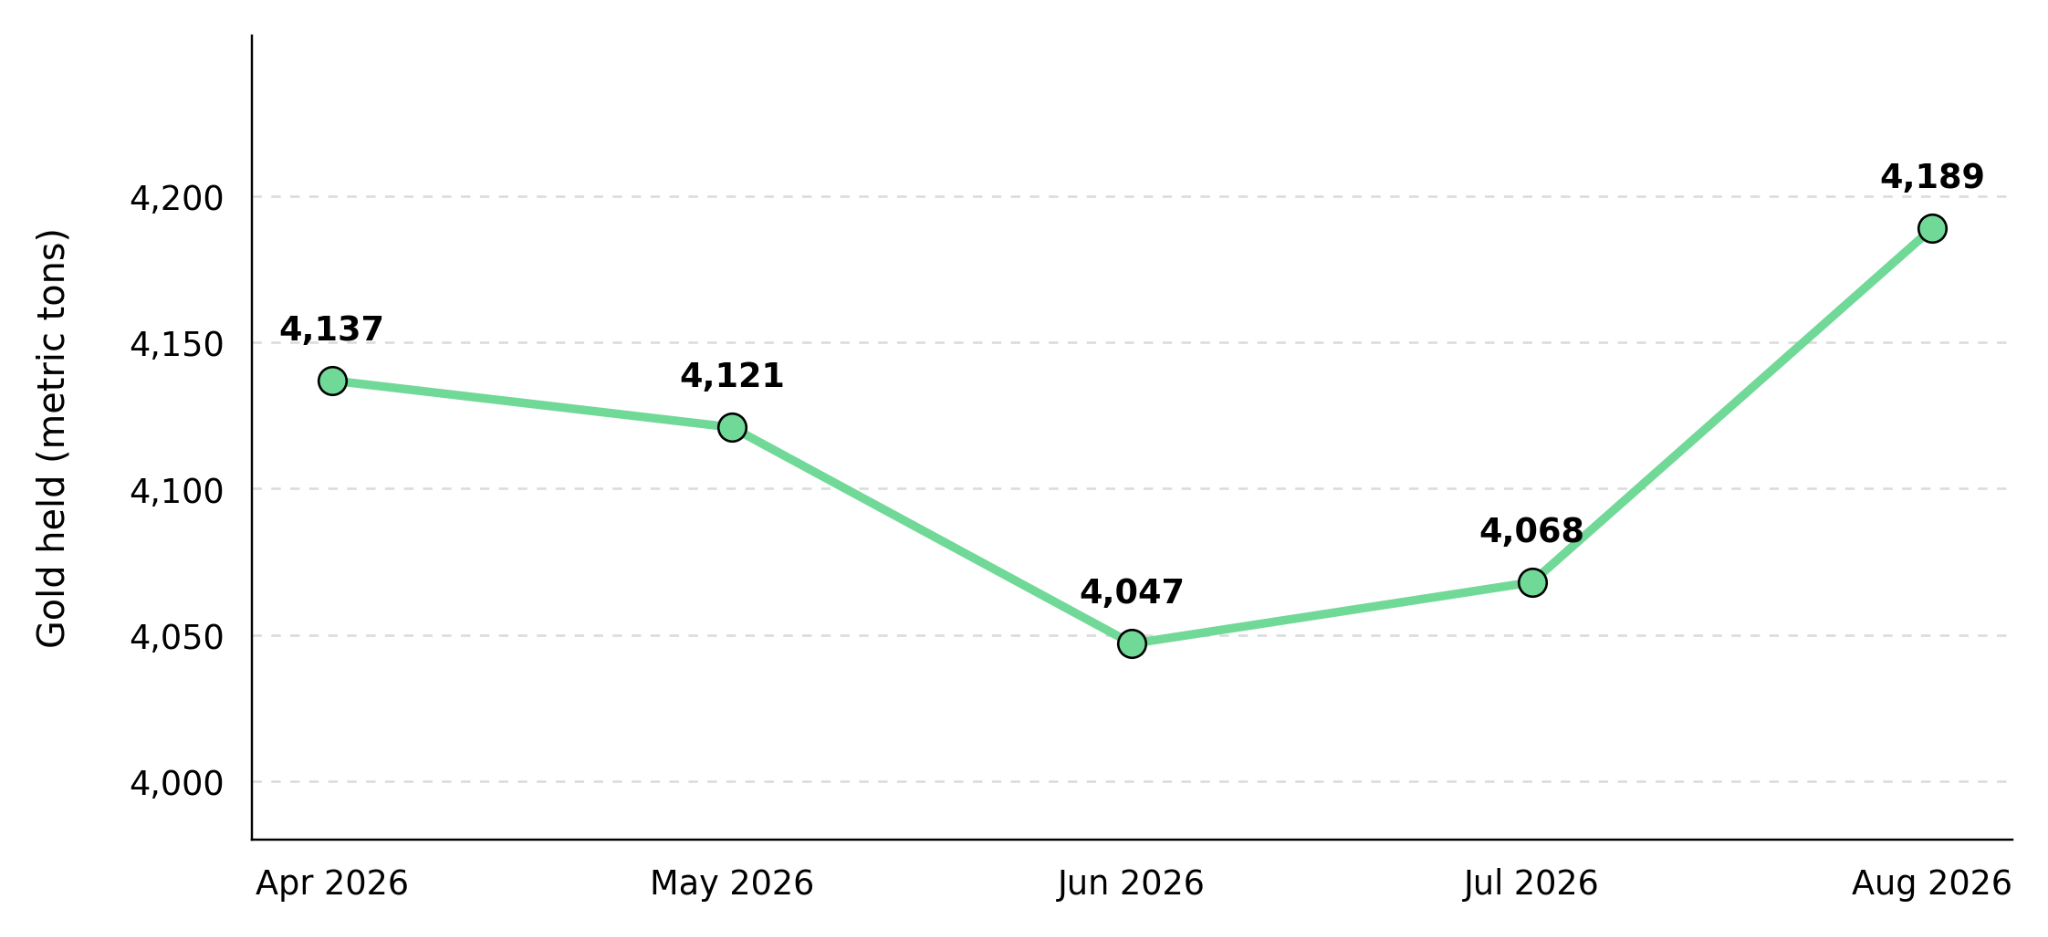
- The World Gold Council (WGC) reported in Gold ETF Flows: August 2026, published September 9, that physically backed gold exchange-traded funds (ETFs) attracted $18 billion and added 121 metric tons, lifting holdings to a record 4,189 metric tons. August’s one-month increase exceeded the 45 metric tons of ETF outflows recorded across the entire second quarter.
- North American gold ETFs attracted $7.7 billion in August, while European funds attracted $7.9 billion. Buying in both regions broadened the sources of bullion demand; subsequent holdings data will show whether physical purchases continued after August.
- Bullion ETF inflows increase fund holdings without providing cash to mining companies. Mine growth requires operating cash flow or financing, while junior-miner index membership can separately widen the pool of funds eligible to hold mining shares.
- The WGC’s Gold Demand Trends: Q2 2026, published July 30, recorded mine production of 966 metric tons, up 2% year over year, and recycling of 326 metric tons, down 6%. New mine output takes longer to reach the market because expansions require drilling, construction and a production ramp-up.
- The Fed raised its target rate by 0.25 percentage points to 3.75%-4.00% on September 16, increasing the rate hurdle for holding gold, which pays no interest. Further growth in ETF gold holdings under the higher rate would show that physical fund buying continued despite that hurdle.
August Gold ETF Buying Reverses Outflows & Lifts Holdings to a Record
The World Gold Council recorded a 45-metric-ton decline in physically backed ETF holdings during the second quarter. Its Gold ETF Flows: August 2026, reported a 121 metric ton increase in August, lifting holdings to a record 4,189 metric tons. The August report also recorded $18 billion in fund inflows and a 16% rise in assets under management (AUM) to $615 billion, with the higher gold price contributing to the AUM increase. Cash inflows measure money entering funds, while changes in holdings measure how much gold those funds added.
Positive ETF flows across regions for the week through September 18. That result shows buying continued into September, but does not establish that August’s $18 billion monthly pace continued. Subsequent changes in ETF gold holdings will show whether physical fund demand continues despite higher policy rates.
Europe & North America Drive About 87% of August Gold ETF Inflows
$7.9 billion of inflows into European funds, the strongest month on record, and $7.7 billion into North American funds, their third-largest. Together, the regions supplied about 87% of the $18 billion global inflow, while Asian funds added $2 billion. WGC cited concerns about government borrowing costs as a possible contributor to European buying; North American funds added roughly $4 billion in the five trading days beginning August 17.
Buying across several regions reduces reliance on any single market, although Europe and North America supplied most of August’s inflows. Subsequent changes in ETF gold holdings will show whether physical purchases continued beyond the week ending September 18 despite higher rates; outflows from either major region would reduce its contribution to global demand.
Gold ETF Buying Adds Bullion & Mine Growth Needs Separate Funding
Physically backed gold ETFs hold bullion rather than mining shares, so fund inflows do not directly finance mine operations. A producer’s cash available for operations and growth depends on ounces sold, realized gold prices and costs. First-quarter industry-average all-in sustaining costs (AISC) of $1,785 per ounce, up 16% year over year, partly because of higher royalties and corporate overhead. AISC includes costs needed to maintain production; at a given gold price, a higher AISC leaves less cash per ounce for growth spending.
Junior-Miner Index Inclusion Expands Fund Access & May Support Liquidity
Index membership can make shares eligible for institutional strategies. It does not establish the scale of purchases or guarantee inclusion in every related fund; operating results still matter. Mineros S.A. joined two junior gold miner indexes and the small-cap segment of the FTSE Global Equity Index Series on September 21. The additions increase its visibility to funds that track those indexes and could support share liquidity.
Gold ETF Buying Lifts Demand
Gold ETF holdings can rise within a month, while additional mine output depends on mining and processing capacity. 966 metric tons of mine production in the second quarter, up 2% year over year, while recycling fell 6% to 326 metric tons. Those changes largely offset, leaving total supply, including net producer hedging, virtually unchanged at 1,269 metric tons. Higher mining volumes improve a mine’s financial results when they produce more saleable gold or lower the cost per ounce.
Mine Upgrades Lift Gold Output & Higher Prices Support Cash Flow
Integra Resources increased second-quarter gold production at Florida Canyon by 30% from the first quarter to 16,379 ounces and generated $9.3 million in free cash flow. More ore placed on its processing pads is expected to support production through the rest of 2026, while its updated eight-year mine plan extends the operation’s projected production horizon.
George Salamis, Chief Executive Officer of Integra Resources, explains how mine planning can increase ore production:
“So, maybe the future looks like less waste mining, more ore mining in the end of the day.”
TRX Gold produced a record 29,650 ounces in fiscal 2026, up 57% year over year and at the top of its guidance range. Upgrades to its existing plant and a contracted expansion expected to take 12 to 18 months provide a path to higher production capacity. Its addition to the MVIS Global Junior Gold Miners Index could also increase its visibility among funds tracking the index.
Stephen Mullowney, Chief Executive Officer, attributes cash growth to ounces and gold prices:
“It's both the increase in ounces and increase in gold price.”
Near-Mine Drilling Tests Future Ore Supply for Producing Gold Mines
A deposit near an operating mine can provide additional mill feed if drilling establishes enough continuous gold-bearing rock to mine economically. A higher gold price can lower the cut-off grade, the minimum grade worth mining and processing, allowing more known material into a mine plan when costs and recoveries support it.
West Red Lake Gold Mines achieved commercial production at Madsen in January 2026. The company reported a second-quarter output of 8,576 ounces, up 51% from the first quarter, and maintained 2026 guidance of 35,000 to 45,000 ounces. The first five drill holes at past-producing Starratt-Olsen, about 1.1 kilometers from Madsen, test whether the deposit could eventually supply additional ore to the operating mill.
Serabi Gold completed 20,831 meters of drilling in the first half of 2026 at its producing Palito and Coringa sites, testing extensions to known deposits and a potentially larger mineralized system at Palito. Updated resource estimates expected in the first quarter of 2027 will show how much gold inventory the program adds and help guide future expansion plans.
Feasibility Studies & Water Approvals Set Gold Supply Timelines
Exploration projects can add gold supply after drilling defines a deposit, studies establish likely recoveries and costs, and permits, water access and financing allow construction. At a given production forecast, a higher gold price raises projected revenue but does not secure those approvals or build the facilities needed to produce gold.
Drilling & Processing Studies Test Proposed Gold Mine Scale
P2 Gold reported extensions to known gold-copper mineralization at its Gabbs project in Nevada and is studying a mill that could process 12 million metric tons annually from the proposed operation’s third year. An updated resource estimate expected in the fourth quarter of 2026 and a feasibility study targeted for the first quarter of 2027 will define the project’s scale and projected economics more clearly.
At Gabbs, the planned acquisition of water rights covering 2,500 acre-feet per year remains conditional on Nevada approving their use for mining and processing instead of irrigation. Planned pump tests will measure water availability, while environmental baseline work supports a mining-plan submission targeted for the first quarter of 2027. Those findings and approvals will help determine whether the proposed processing scale can be supported and how the project advances through permitting.
Fed Hike & Stronger Dollar Test Gold ETF Demand
The Federal Reserve raised its target range by 25 basis points to 3.75% to 4.00% on September 16. Higher yields increase gold's holding cost, yet WGC reported positive regional ETF flows in the week through September 18 despite firmer yields and a stronger dollar. That week's resilience does not eliminate rate sensitivity.
Regional ETF Tonnage Gains Would Confirm Continued Gold Buying
The next WGC ETF update will show whether physically backed fund holdings exceed August’s record 4,189 metric tons and which regions added gold. Higher holdings across North America, Europe and Asia would confirm further physical purchases; flat or falling holdings would show that buying did not continue at August’s pace. If AUM rises while the amount of gold held stays flat, a higher bullion price could explain the increase in fund value without additional metal purchases.
Higher Real Yields & Stronger Dollar Pressure Gold Prices & Mine Margins
Reuters reported spot gold at $4,336.21 per ounce on September 22, down 0.2% as markets weighed further Fed tightening. Rising real yields, the inflation-adjusted return on bonds, increase the return available from bonds relative to gold, which pays no interest; a stronger US dollar can also raise bullion’s price in other currencies. Changes in ETF gold holdings show whether funds continue adding metal despite those rate and currency pressures.
August’s record ETF holdings document physical buying, while the September 22 spot decline shows that expected Fed hikes can still pressure gold prices. Mine revenue depends on recovered ounces sold and realized prices; sustaining costs affect cash retained, while capital and approvals determine when additional production can begin.
The Investment Thesis for Gold
- Changes in physically backed ETF holdings show how much gold funds added or sold, separating physical demand from gains in the gold price.
- More gold sold and a wider gap between realized prices and AISC can improve a producer’s ability to fund mine maintenance and expansion from operating cash flow.
- Existing mines can add output through plant upgrades when they can supply enough ore and recover additional gold; undeveloped deposits must first secure approvals and complete construction.
- A deposit confirmed by near-mine drilling may provide additional ore for an existing mill if its size and mine access support production.
- Explorers need resource estimates and recovery tests to support mine plans, while developers need water access, permits and construction financing before they can add production.
- Secure mineral and water rights, defined permit steps, road and power access, and community engagement make mine schedules and capital budgets easier to assess.
August’s $18 billion in physically backed ETF inflows coincided with a 121-metric-ton increase in fund holdings, documenting additional bullion demand. Higher gold prices can increase revenue per ounce sold, but mine cash generation still depends on recovered production, AISC and capital spending. Reading fund holdings alongside mine cash flow distinguishes physical buying from the ability to deliver profitable new ounces.
TL;DR
Physically backed gold exchange-traded funds (ETFs) drew $18 billion in August and added 121 metric tons, lifting holdings to a record 4,189 metric tons after second-quarter outflows. Europe and North America accounted for about 87% of inflows. Mine production rose 2% year over year in the second quarter, while recycling fell 6%, leaving total supply nearly unchanged. ETF purchases add bullion demand but do not directly finance mines. Mine cash flow depends on gold sold, realized prices and sustaining costs; new output also requires recoverable ore, capital, water access and permits. Regional ETF flows remained positive in the week through September 18, but higher rates and a firmer dollar make future holdings data important.
FAQs (AI-Generated)
Analyst's Notes





Subscribe to Our Channel










Stay Informed