US Fed Rate-Cut Expectations & Bullion Market Momentum: Why Gold and Silver Prices Are Poised for Upside into Year-End 2025


Fed rate-cut expectations drive gold and silver prices higher into 2025 year-end. Low-AISC producers and developers positioned for margin expansion as real yields fall.
- Expectations ahead of the December 9-10 Federal Reserve meeting have become the dominant catalyst for gold and silver, reinforcing price strength into Christmas and New Year 2025-2026.
- A weaker US dollar, firm central bank demand, and growing fund positioning continue to create a constructive macro backdrop for bullion.
- Silver is outperforming gold on the back of industrial demand, hitting fresh record highs, adding a second structural driver to the broader precious metals complex.
- Development and exploration companies with low All-In Sustaining Cost (AISC) profiles, strong balance sheets, and near-term production pipelines are positioned to benefit disproportionately from stronger bullion pricing.
- Investors should focus on operators with technical leverage to higher gold and silver prices, permitting clarity, and catalysts scheduled around feasibility studies, drilling results, and project construction decisions.
The Macro Catalyst Driving Precious Metals into Year-End
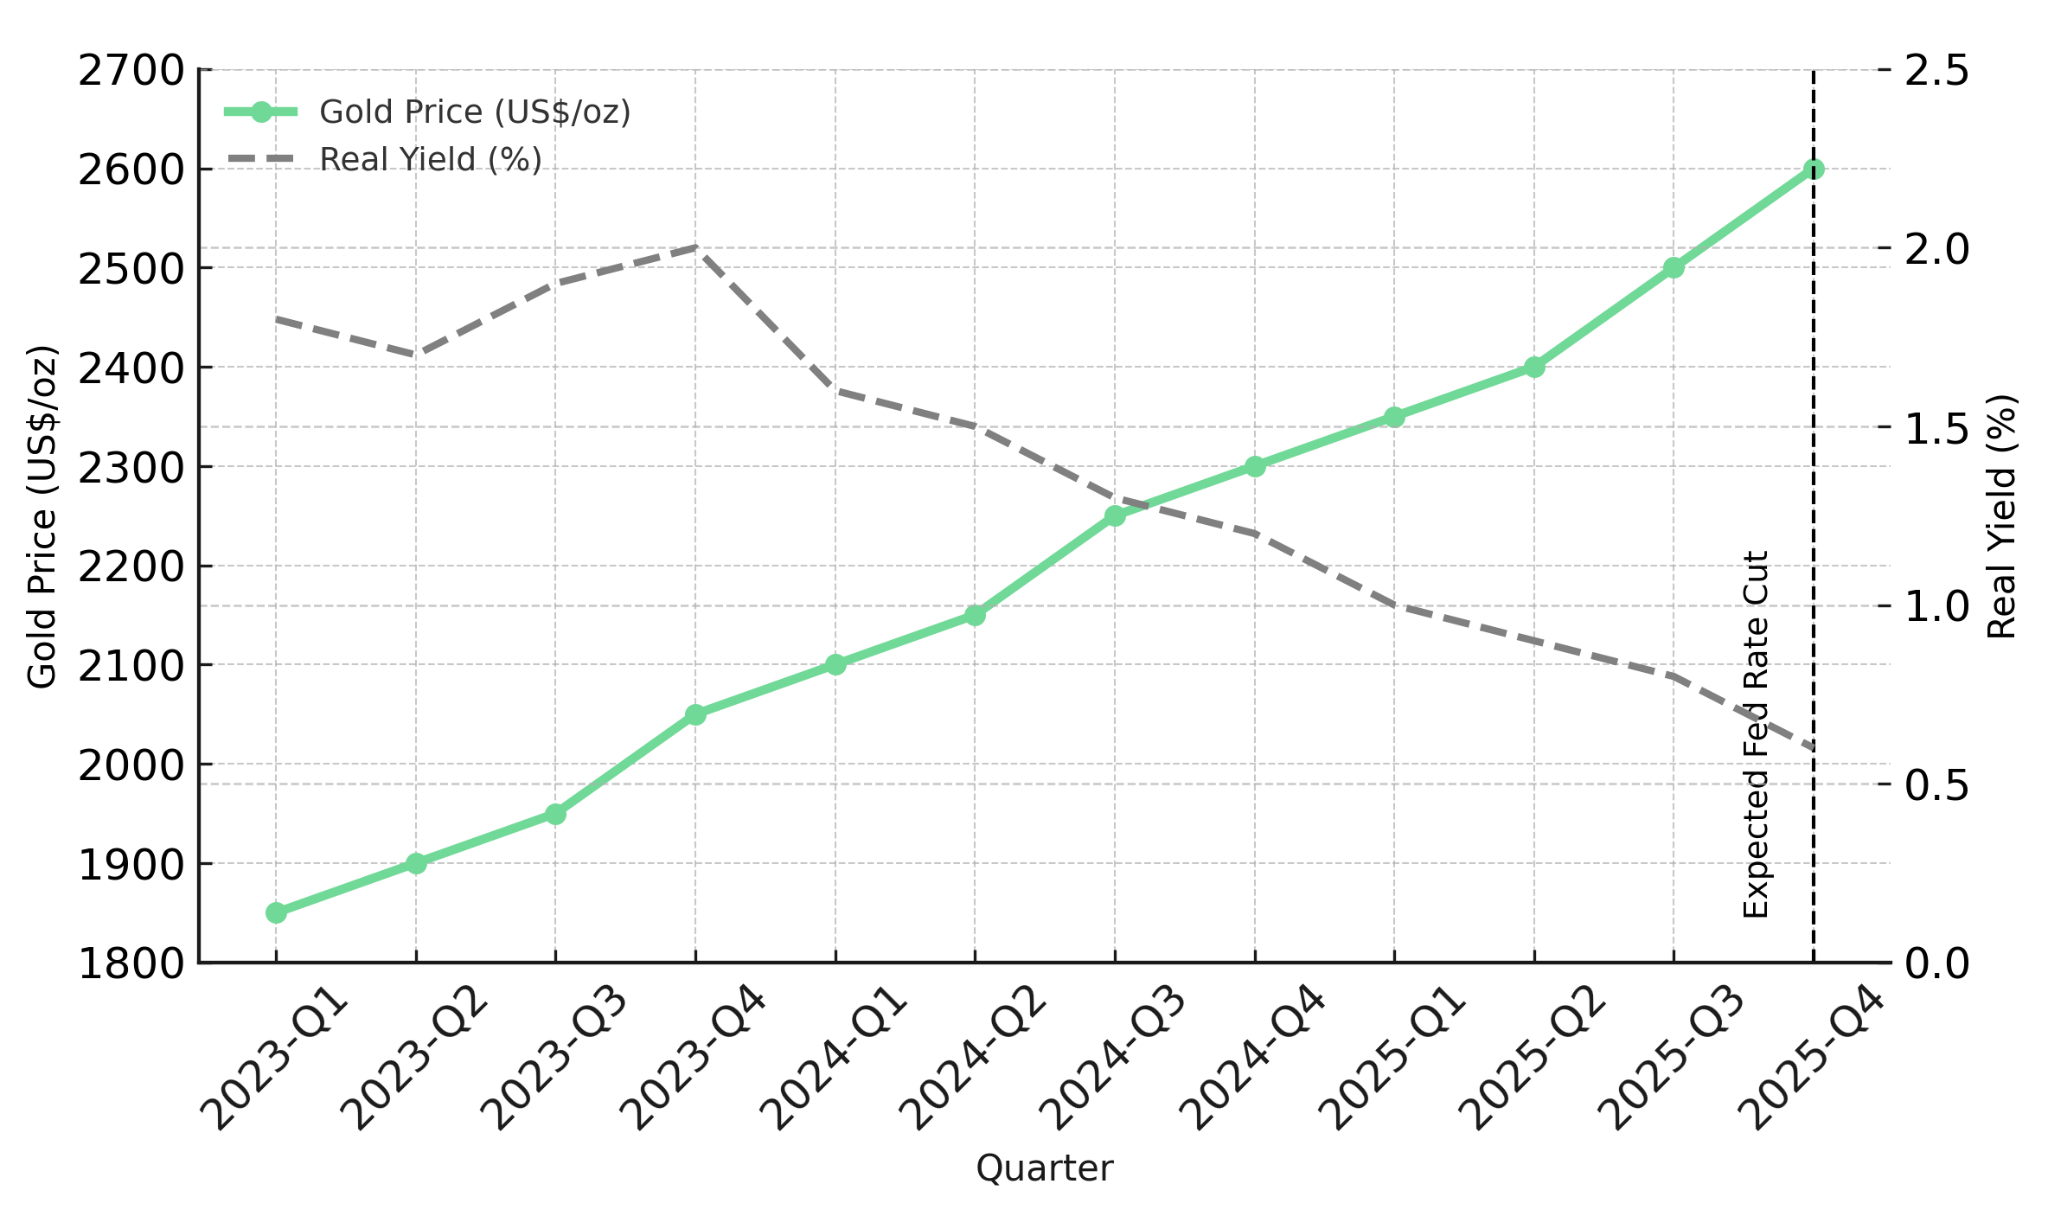
Gold enters the final weeks of 2025 supported by monetary policy expectations, central bank accumulation, and weakening currency dynamics. Market positioning is shaped by anticipation of the December 9–10 Federal Reserve rate-cut meeting, where investors expect clearer forward guidance. Historically, rate cuts compress real yields, one of gold's strongest macro correlations, and reinforce safe-haven flows from institutions and sovereign buyers.
During the week ending December 6, 2025, gold declined modestly by 0.28% on Comex, while silver surged 4.19% on Friday, December 6, establishing a new lifetime high at US$59.90 per ounce. The divergence reflects gold's sensitivity to rate expectations and silver's sensitivity to global manufacturing and clean-energy growth. Investor behavior has shifted from defensive to opportunistic, creating a macro environment that benefits low-cost producers, companies under development and exploration targeting high-grade discoveries.
Monetary Policy, Real Yields & Currency Trends
As markets price in rate cuts, real yields tend to fall faster than nominal rates, magnifying bullion attractiveness relative to yield-bearing assets. A weaker US dollar adds another tailwind. This context reinforces the importance of projects with robust margins, low AISC profiles, and exposure to high-grade mineralization. Companies such as Perseus Mining, a multi-mine producer, Integra Resources operating the Florida Canyon Mine in Nevada, and Cabral Gold advancing its heap-leach oxide project offer differentiated sensitivity to gold price moves.
For silver-linked companies like Hycroft Mining with 10.6 million ounces Measured and Indicated (M&I) gold and 361 million ounces M&I silver, real-yield compression amplifies the investment case for advancing large-scale gold-silver systems. Improved financing conditions reduce dilution risk while enhancing project valuations through lower discount rates applied to Net Present Value (NPV) calculations.
Silver Outperformance & Industrial Demand as a Secondary Macro Driver
Silver's industrial role, particularly in solar photovoltaics, is increasingly influencing its price response. The metal's 4.19% single-session surge illustrates a stronger feedback loop between energy-transition demand and tightening supply. This dynamic matters for large resource holders like Hycroft Mining with 1.181 B oz of M&I Silver at 44.85 g/t. The industrial component provides downside support during volatility while creating upside leverage during simultaneous expansion in both investment and manufacturing demand.
Implications for Producers: Margin Expansion & Operational De-Risking
Producers with multi-asset platforms are positioned to convert higher metal prices into immediate cash flow improvements.
Perseus Mining: Multi-Asset Cash Flow Generation
Perseus Mining demonstrates this advantage across three West African mines, with fiscal year 2025 AISC of US$1,235 per ounce and Earnings Before Interest, Taxes, Depreciation, and Amortization (EBITDA) margins averaging 59.3%.
Perseus Mining's Managing Director and Chief Executive Officer Craig Jones noted that as of June 30, 2025, the company held net cash and bullion of US$827 million, with five-year capital expenditure of over US$800 million fully covered by current cash flows.
"We can pay for all of our aspirations within our current cash flows."
Serabi Gold: High-Grade Brownfield Expansion
Serabi Gold targets greater than 12 grams per tonne (g/t) product feeds from its new ore-sorting plant beginning in 2026. Chief Executive Officer Mike Hodgson emphasized strong cash generation supporting both operations and exploration, with the company aiming to grow resources to 1.5-2.0 million ounces by 2026. With fiscal 2025 production guidance of 44,000 to 47,000 ounces and year-to-date Q2 2025 profit before tax of US$26.3 million, cash generation supports aggressive brownfield programs.
i-80 Gold & New Found Gold: Infrastructure Control and Strategic Acquisitions
i-80 Gold's ownership of the Lone Tree Autoclave shields operations from third-party processing costs. The company is completing engineering work for autoclave refurbishment, expected Q4 2025, with processing operations scheduled to commence in 2028. Current toll milling achieves 55-60% payability on refractory material, but the autoclave will increase recovery to approximately 92%.
President and Chief Executive Officer Richard Young emphasized the strategic value of controlling processing infrastructure, noting the company targets 150,000 to 200,000 ounces annually during 2028-2029, with EBITDA between US$200 million and US$300 million depending on gold prices.
"By 2028 we expect to produce about 200,000 ounces per year and generate EBITDA somewhere between $200 and $300 million depending on the price of gold."
West Red Lake Gold Mines: High-Grade Production Ramp-Up
West Red Lake Gold Mines' Madsen Mine, which restarted in May 2025 and is ramping up production, demonstrates high-grade leverage with 8.2 g/t diluted head grade. The Rowan deposit features 12.78 g/t indicated grade. Ramp-up milestones including shaft skipping, which moves ore at approximately 10% of trucking costs targeting 350 tonnes per day by year-end, improve unit costs.
Vice President of Communications Gwen Preston noted strong investor resonance with the company's production ramp trajectory. The combined operations target approximately 100,000 ounces annually by 2029.
"The indicated resource there is almost 13 grams per ton, it's like asking to be mined."
Preston emphasized the company's growth orientation aligned with market conditions.
"West Red Lake was always built to grow with the gold market...our goal is 300,000 ounces in this market."
Development-Stage Companies: Cost of Capital & Valuation Sensitivity
Development companies experience greater valuation torque during bullish pricing environments due to direct impact on project economics. Rate cuts lower discount rates, enhance returns, and reduce dilution risk.
Cabral Gold: Rapid-Payback Oxide Development
Cabral Gold's Cuiú Cuiú oxide project exemplifies alignment with this macro environment. According to the July 2025 Preliminary Feasibility Study (PFS), the project delivers 78% Internal Rate of Return (IRR), US$74 million NPV at 5% discount, and AISC of US$1,210 per ounce at US$2,500 gold. With capital expenditure of US$37.7 million and 10-month payback, the project minimizes financing dependency.
Founder Alan Carter detailed construction progress and district potential, with the stage one operation targeting first production during H2 2026. The company is pursuing project financing solutions to minimize equity dilution.
"We have a fully funded stage one starter operation that is currently in construction and expected to produce gold for the first time in the fourth quarter of 2026."
Carter emphasized exploration upside beyond initial development.
"We've got not one new discovery but four new discoveries since the resource was last updated, it is a district scale project."
U.S. Gold Corp: Fully Permitted Wyoming Development
U.S. Gold Corp's CK Gold Project, located approximately 20 miles west of Cheyenne, Wyoming, has obtained all major permits. According to the February 2025 Pre-Feasibility Study, the project delivers AISC of US$937 per ounce gold equivalent (AuEq), NPV5 of US$356 million, and IRR of 29.5%.
Chairman Luke Norman highlighted competitive positioning in the current capital environment, noting the project benefits from simple mining methods similar to existing regional operations and existing infrastructure including roads, water, and power access.
"There's a slew of readily available capital really chasing very few projects that are permitted and ready to go, so we have that advantage."
Integra Resources: Producer with Multi-Asset Development Pipeline
Integra Resources operates as a Nevada producer at Florida Canyon while developing DeLamar in Idaho and Nevada North. With 7.0 million ounces AuEq M&I inventory and DeLamar PFS showing AISC of US$814 per ounce and 33% IRR, the company offers multi-asset leverage. President and Chief Executive Officer George Salamis noted operational margins substantially exceed original expectations:
"The margins are great...now it's doing much more than that."
With approximately US$81 million treasury and positive Florida Canyon cash flow, the company funds US$48-63 million in annual capital.
"We have a treasury of $63 million...we're producing, we're making cash flow."
Salamis anticipates a two-year NEPA process duration following Q3 2025 completion of the Mine Plan of Operations, supported by recent federal executive orders streamlining permitting.
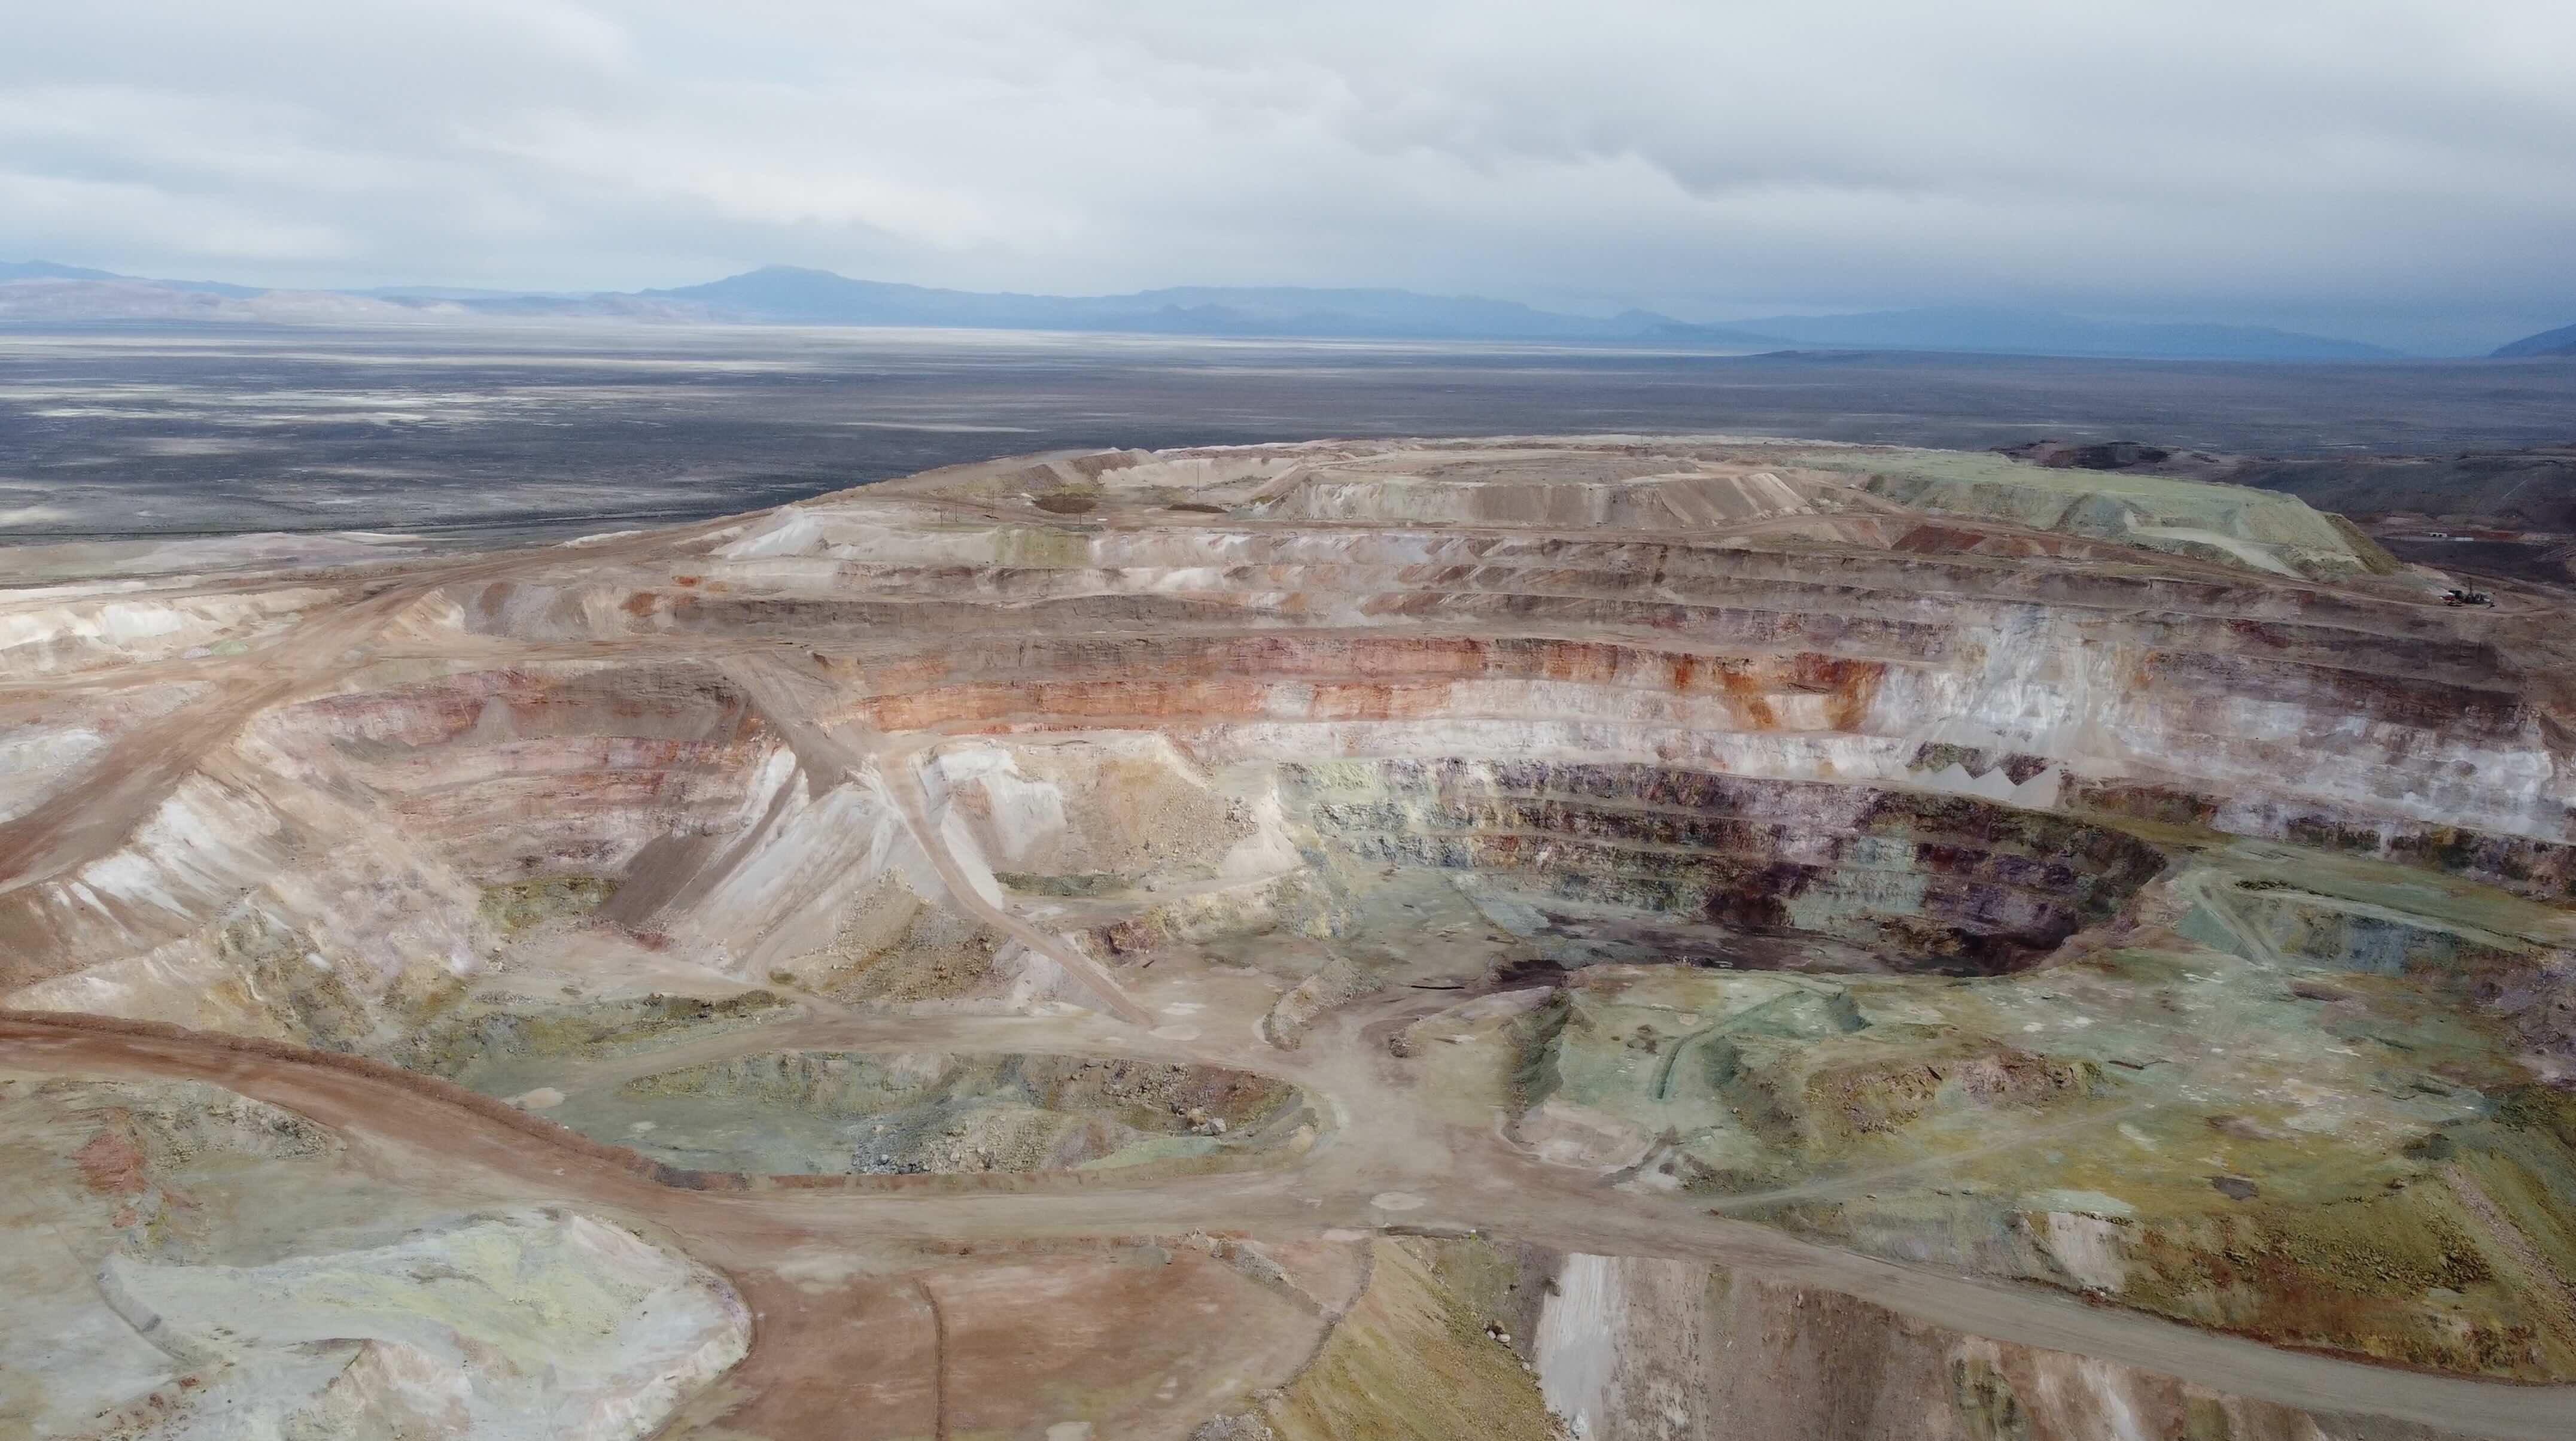
Hycroft Mining: Large-Scale Resource Advancement with Metallurgical Breakthroughs
Hycroft Mining's large-scale Nevada asset, containing 10.6 million ounces M&I gold and 361 million ounces M&I silver, exemplifies how improved capital conditions benefit projects with significant resource scale and existing infrastructure. The company is advancing toward a PEA/PFS expected Q4 2025 that will incorporate recent metallurgical breakthroughs achieving 89% gold and 93% silver flotation recoveries, statistically significant improvements over prior technical work.
With US$175 million cash as of October 15, 2025, and zero debt following recent debt repayment, Hycroft maintains financial flexibility to advance technical studies while funding its 14,500-meter drill program targeting high-grade silver extensions at Brimstone and Vortex, where recent intersections included 18.2 meters at 1,987 grams per tonne silver.
New Found Gold: Hammerdown Cash Flow Funding Queensway Development
New Found Gold acquired the producing Hammerdown operation, which achieved first gold pour in November 2025 and is ramping to full production in early 2026. Chief Executive Officer Keith Boyle explained the strategic rationale, noting the transition from exploration into production while gaining hands-on processing facility experience.
"We saw the cash flow from Hammerdown as a piece of the financing for our Queensway phase one."
New Found Gold combines Hammerdown cash flow with Queensway's high-grade mineralization, demonstrated by drill results including 159.92 g/t gold over 10.30 meters at Keats. Queensway Phase 1 targets 2027 construction leading to production from 2027-2030 utilizing 700 tonnes per day processing of high-grade open pit material.
Tudor Gold: North America's Largest Undeveloped Gold-Copper-Silver Asset
Tudor Gold's Treaty Creek deposit contains 27.87 million ounces AuEq according to the April 2024 resource estimate, ranking among North America's largest gold-copper-silver projects. The company plans to file permits for an underground exploration ramp in 2025, focusing on the SC-1 high-grade zone characterized by visible gold intersections within quartz stockwork systems.
President and Chief Executive Officer Joseph Ovsenek emphasized improved capital access, noting frequent investor interest reflecting substantial market change.
"The nice thing about this market, there's lots of capital so you can push hard."
Joseph Ovsenek explained the strategic focus on high-grade underground development as the quickest path to permitting and production due to smaller environmental footprints.
"Underground high-grade, higher grade, smaller footprint mine is the quickest thing to permit, to build, to get going, that's our focus."
Exploration Leverage: High-Grade Discoveries & District-Scale Upside
Exploration-stage companies historically outperform in early phases of gold uptrends as rising prices expand geological and economic envelopes.
P2 Gold: Polymetallic Valuation Disconnect
P2 Gold's Gabbs Project, advancing from its 2025 Preliminary Economic Assessment (PEA) showing 33.8% after-tax IRR, US$942.9 million NPV5, and sub-three-year payback, demonstrates strong optionality to both gold and copper pricing. The project targets construction completion and production in 2028. As of December 4, 2025, P2 Gold's market capitalization of US$72 million suggests significant valuation disconnect relative to project economics.
Capital Markets Dynamics Heading into 2026
Fed policy shifts tend to catalyze renewed capital inflows into mining equities. Lower rates reduce financing costs for construction-stage projects and improve equity valuations. Companies with strong treasury positions including Hycroft with US$175 million as of October 15, 2025, Perseus with US$827 million as of June 30, 2025, and Integra with approximately US$81 million benefit from reduced dilution risk and stronger negotiating leverage.
Risk Considerations & Macroeconomic Volatility
Despite a bullish setup, investors must weigh risks around inflation prints, employment trends, geopolitical tensions, and Chinese economic momentum. A stronger-than-expected dollar or delayed rate cuts could temporarily cap gold's upside. Company-specific risks relate to permitting timelines, metallurgy, financing structures, and execution capacity. However, companies in Tier-1 jurisdictions with strong balance sheets tend to outperform during macro uncertainty.
The Investment Thesis for Gold
- Rate-cut expectations enter a critical window ahead of the December 9–10 Federal Reserve meeting, lowering real yields and strengthening gold's macro foundation into year-end.
- Silver's industrial demand accelerates, driven primarily by solar photovoltaic consumption, creating a secondary driver that supports multi-metal developers.
- Producers with low AISC profiles including Integra Resources, Perseus Mining, Serabi Gold, West Red Lake Gold Mines and i-80 Gold are positioned for margin expansion and stronger free cash flow generation as gold prices remain elevated way above US$2,600 per ounce.
- Developers including Cabral Gold, Hycroft Mining Holding Corporation, New Found Gold, Tudor Gold and U.S. Gold Corp benefit from improved financing conditions, shorter paybacks, and rising NPVs under elevated price decks combined with lower discount rates.
- Explorers with high-grade systems including P2 Gold offer outsized leverage to price increases and can expand resource envelopes economically at higher gold prices through optimized cut-off grades.
- Large-scale resource holders like Tudor Gold stand to gain from improved project economics and stronger strategic optionality as investors rotate toward long-life assets with multi-decade production profiles.
- Companies in permissive jurisdictions with approved permits, such as U.S. Gold Corp, capture additional value from reduced regulatory uncertainty and faster paths to construction decisions.
What the Fed's December Policy Path Means for 2026 Positioning
The December 9-10 Fed meeting represents a significant inflection point for bullion markets. As investors anticipate clarity on 2026 monetary policy, both gold and silver are positioned for strength, supported by demand fundamentals and constructive real-yield dynamics. Companies across the value chain stand to benefit from improved margins, enhanced project economics, and amplified valuation multiples. Investors should prioritize companies with strong treasury positions, clear development pipelines, and exposure to high-grade or scalable systems as monetary conditions ease.
TL;DR
Gold and silver enter year-end 2025 supported by Federal Reserve rate-cut expectations ahead of the December 9-10 meeting. Lower real yields historically strengthen bullion prices, benefiting producers with low All-In Sustaining Costs and robust balance sheets. Silver hit a record US$59.90/oz on December 6, driven by solar photovoltaic demand alongside monetary factors. Development-stage companies gain from improved financing conditions and higher NPV calculations under lower discount rates. Producers like Perseus Mining, Integra Resources, and Serabi Gold offer immediate margin expansion, while developers including Cabral Gold, Hycroft Mining, and U.S. Gold Corp benefit from reduced dilution risk and shorter project paybacks as capital conditions improve.
FAQs (AI-Generated)
Rate cuts compress real yields, making non-yielding assets like gold more attractive relative to bonds. Lower rates also weaken the US dollar, providing an additional tailwind for bullion prices.
Silver benefits from both monetary policy expectations and industrial demand, particularly from solar photovoltaic manufacturing. This dual demand driver creates stronger price momentum compared to gold's purely monetary sensitivity.
All-In Sustaining Cost measures total production cost per ounce. Lower AISC producers capture greater margin expansion when gold prices rise, translating directly into improved cash flow and shareholder returns.
Lower rates reduce discount rates applied to NPV calculations, improving project valuations. Cheaper financing also reduces equity dilution risk and shortens payback periods on capital investments.
Key risks include stronger-than-expected inflation, delayed rate cuts, US dollar strength, and company-specific factors such as permitting delays, metallurgical challenges, and execution capacity.
Analyst's Notes


Subscribe to Our Channel


Stay Informed