A 16-Year Development Timeline & Plateauing Mine Supply Increase the Value of Future Gold Supply


A 16-year development timeline and plateauing mine supply increase the value of future gold supply amid continued central-bank buying.
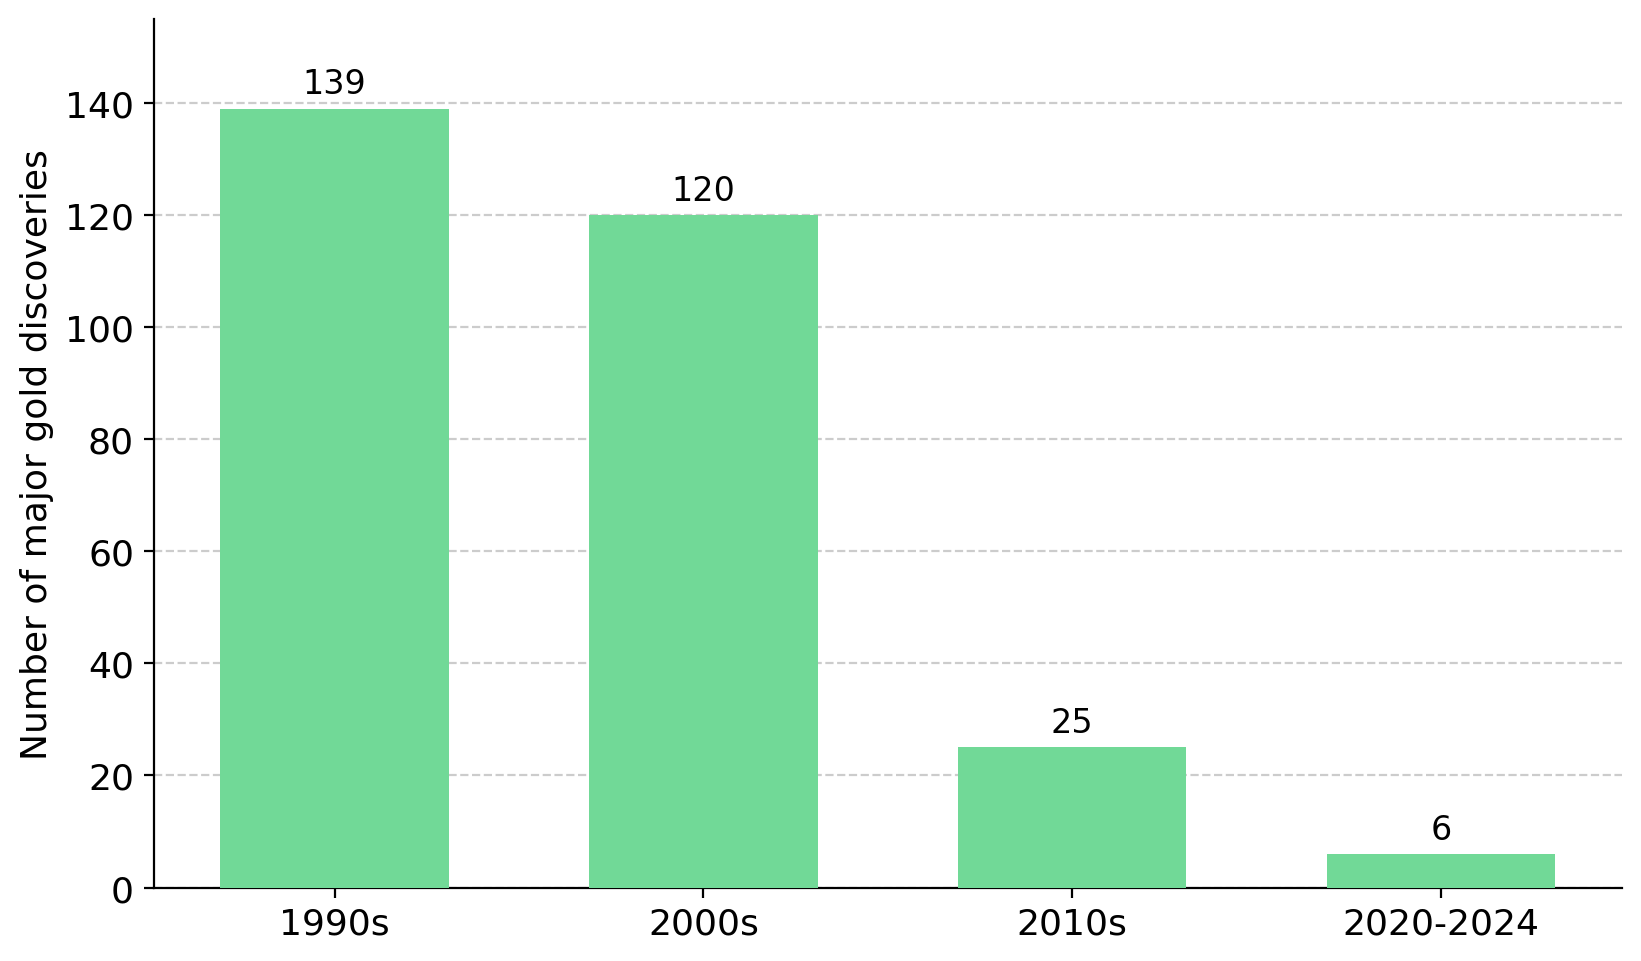
- S&P Global has recorded only five to six major gold discoveries, defined as deposits containing at least 2 million ounces, since 2020 and none during 2023 or 2024, limiting the number of large projects available to replace future mine supply.
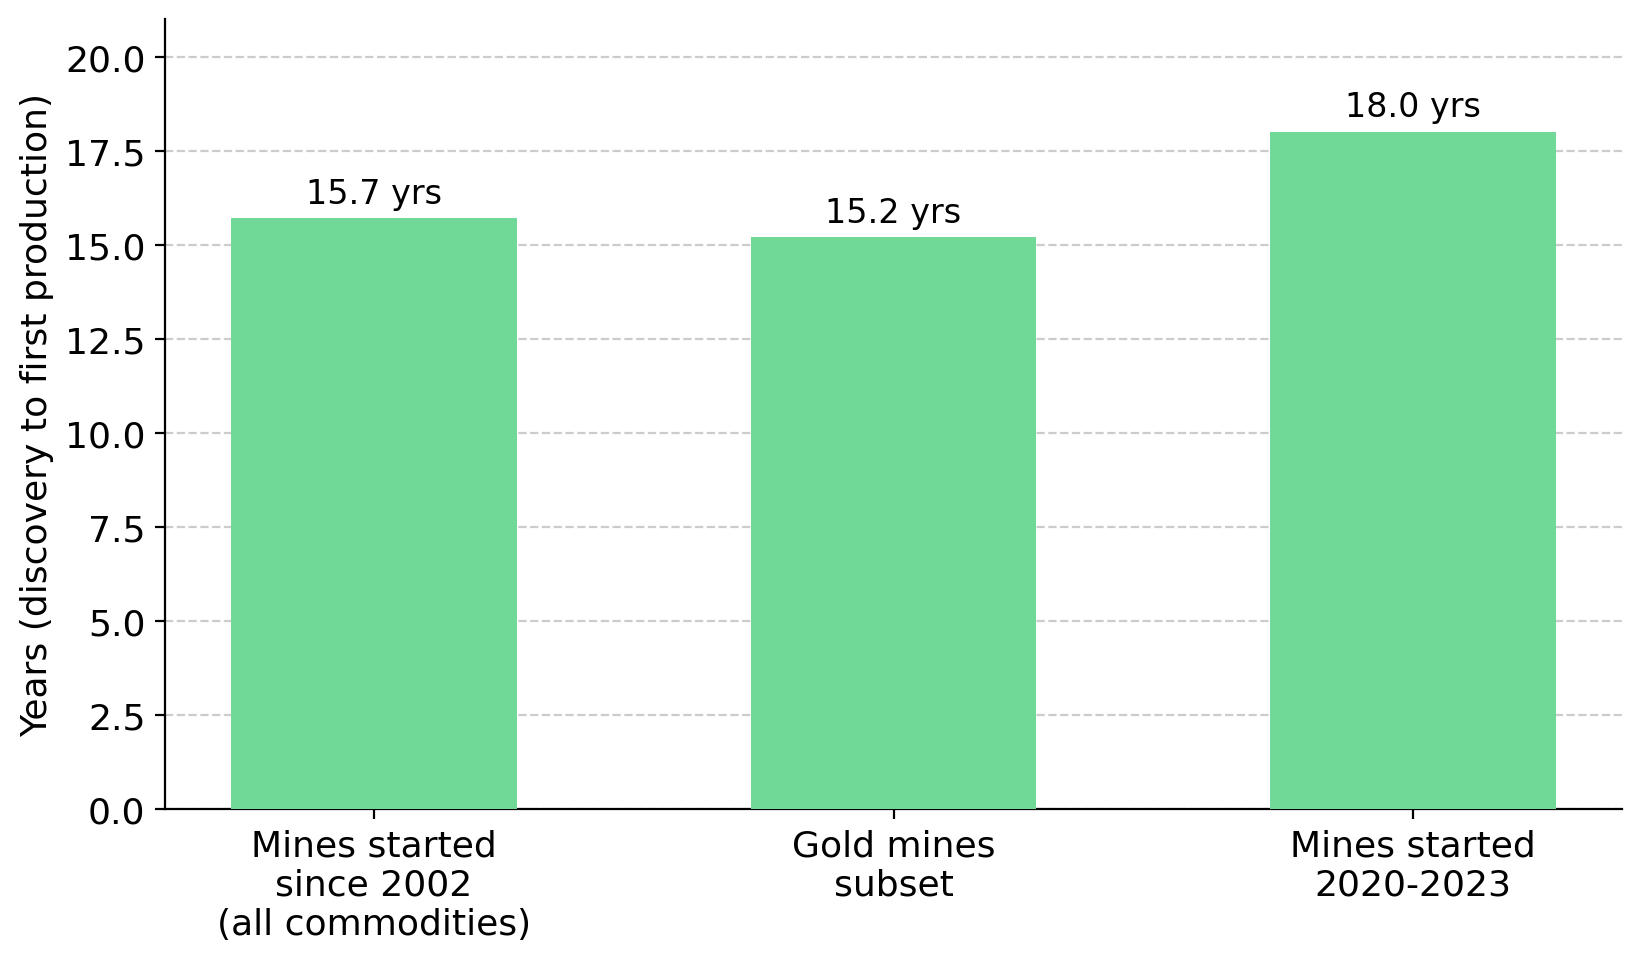
- According to S&P Global, the average mine takes about 16 years from discovery to first production, meaning a major discovery made today would not add supply until the late 2030s or beyond.
- The World Gold Council expects mined production to plateau, while the US Geological Survey puts world reserves at about 64,000 tonnes, equivalent to roughly 18 to 20 years of output at current rates if reserves are not replaced.
- US policy has shifted, with a March 2025 executive order naming gold a covered mineral and moving to fast-track permitting, potentially reducing development timelines for qualifying projects.
- Because developers and explorers represent future supply, their valuations depend more on jurisdiction, resource confidence, grade, and execution than on the current spot price.
Discovery Rates Fall as Grassroots Exploration Retreats
Gold supply is constrained by a lack of new discoveries rather than current mine output. S&P Global Market Intelligence defines a major discovery as a deposit containing at least 2 Moz, the basis of future mine supply. S&P has catalogued roughly 350 such deposits since 1990 containing nearly 3 billion ounces, yet only five to six have been discovered since 2020, adding 17-27 Moz, with no major discoveries recorded in 2023 or 2024. Most additions to S&P's major-discovery inventory in recent years were deposits discovered decades ago that only recently exceeded the 2 Moz threshold rather than new discoveries.
New discoveries are becoming smaller, while less exploration spending is directed toward finding new deposits. S&P data show the average discovery size fell to 4.4 Moz in 2020-2024 from 7.7 Moz in the prior decade, and none of the past ten years' discoveries rank among the 30 largest ever. The share of exploration budgets allocated to grassroots exploration fell to about 19% in 2024 from roughly 50% in the mid-1990s. Higher gold prices have not restored grassroots exploration spending to historical levels.
Long Lead Times & Flat Mine Output Limit Future Supply Growth
Large-discovery shortages would matter less if mines could be developed quickly, but development timelines remain long. S&P Global's study of 127 mines that entered production since 2002 found an average lead time of 15.7 years from discovery to first output, including 15.2 years for gold mines, while a follow-up study of mines between 2020 and 2023 put the figure closer to 18 years. A tier-one discovery made today would not reach production until the late 2030s or 2040s, limiting the industry's ability to increase mine supply over the next decade.
The World Gold Council reports mined output was largely unchanged between 2018 and 2024, reaching 3,645 tonnes in 2024, the second-highest annual total on record, with only about 3% volatility over twenty years. The World Gold Council and Metals Focus expect mine output to remain broadly flat as declining reserves, operational disruptions, and rising capital costs constrain new supply, while mined production responds to higher gold prices with a lag of at least six years. S&P's Gold Commodity Briefing Service projects supply to peak near 110 Moz in 2026 before declining toward 103 Moz by 2028. Higher gold prices alone cannot increase mine supply quickly because new production requires years of exploration, permitting, and development.
The US Geological Survey estimated world gold reserves at about 64,000 tonnes in early 2025, while the World Gold Council estimated 54,770 tonnes at the end of 2024, equal to roughly 18-20 years of production if reserves are not replaced. Falling discovery rates make reserve replacement more difficult, as reserves represent the economically mineable portion of the broader resource base. S&P estimates gold head grades have fallen about 13.4% since 2010, requiring miners to move more rock for each ounce produced.
Higher Gold Prices Favor Projects Closest to Production
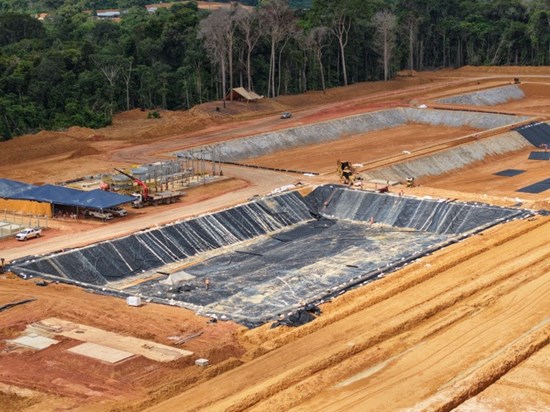
Higher gold prices can encourage new supply, but long development timelines concentrate the supply response in projects that are already close to production. Cabral Gold's Cuiú Cuiú project in Brazil is more than 70% built and targeting first output in the fourth quarter of 2026 through a Phase 1 oxide heap-leach operation, a low-capital route in which gold is recovered from near-surface oxidised ore. Deeply weathered, free-digging saprolite and a strip ratio below one-to-one reduce mining costs.
Alan Carter, President and Chief Executive Officer of Cabral Gold, explains how high gold prices are creating strong margins for new supply:
"There is still a healthy margin at today's gold price. We still expect to make about US$3,000 per ounce that we produce. This is only phase one of a two-phase project."
Bringing the next mine into production depends on project economics as much as on current gold prices. New Found Gold's Newfoundland assets are targeting near-term production, with the Hammerdown mine targeting commercial output in the second half of 2026 and the Pine Cove mill doubling to 1,400 tonnes per day to process higher-grade Queensway feed, supported by US$185 million of funding against a Preliminary Economic Assessment capital figure of US$155 million. Keith Boyle, Chief Executive Officer of New Found Gold, explains how current gold prices are supporting the economics of new mine development:
"For the first couple of years, we're targeting about 100,000 ounces a year at US$1,300 all-in sustaining costs. At today's gold price, we're in the neighbourhood of US$300 million."
Capital Returns to Quality Projects Across the Pipeline
Access to capital increasingly depends on resource quality, project maturity, and development potential. Tudor Gold's Treaty Creek project in British Columbia's Golden Triangle hosts a 24.9-million-ounce indicated and 4-million-ounce inferred Goldstorm deposit at a 0.85 gram-per-tonne overall grade, with a higher-grade core now being evaluated through a Preliminary Economic Assessment. Joe Ovsenek, President and Chief Executive Officer of Tudor Gold, explains how rising gold prices have improved financing conditions for quality projects:
"What they want to see is a path to production. With metal prices staying where they are, cash is starting to trickle down to pure explorers, where investors are willing to back companies with good track records and good properties. The money has not been there for quite a while."
Improving financing conditions can eventually extend beyond advanced projects to earlier-stage opportunities that demonstrate resource-growth potential. Cobra Resources' Manna Hill project in South Australia returned 74 meters at more than 1% copper and roughly 0.25 grams per tonne gold, supporting work toward a maiden resource and evaluation of a larger copper-gold porphyry system. Additional drilling could expand the project's gold inventory as the system is better defined, creating the resource growth that ultimately replenishes the future mine-supply pipeline.
The Earliest Stage Is Where the Next Supply Must Originate
With major discoveries scarce, future supply depends on grassroots and early-stage drilling, where exploration spending has declined for more than two decades. Although grassroots exploration carries the highest geological and financing risk, it remains the primary source of new discoveries that could support mine supply in the 2030s and beyond.
Exploration-stage projects increase in value by converting resources into higher-confidence categories and by expanding the resource base. P2 Gold's Gabbs project in Nevada carried an October 2025 Preliminary Economic Assessment NPV of US$942.9 million and an IRR of 33.8%, with annual output of roughly 110,000 ounces of gold, ahead of an updated resource estimate and Feasibility Study targeted for the fourth quarter of 2026 and a stated objective of reaching about 5 million gold-equivalent ounces. For exploration-stage projects, resource growth remains the primary valuation driver before financing or construction decisions become relevant.
Permitting Reform & Jurisdiction Shape Future Gold Supply
Permitting policy affects future mine supply because deposits cannot enter production without regulatory approval. The US Department of the Interior estimates mine permitting takes seven to ten years in the US versus two to five years in Australia and Canada, while S&P ranks the US among the slowest jurisdictions for bringing mines online. On March 20, 2025, Executive Order 14241 named gold a covered mineral alongside copper, uranium, and potash, fast-tracked qualifying projects through FAST-41, and opened federal financing channels. Although the measure faces legal challenges, faster permitting and access to federal financing could shorten development timelines and reduce political-risk discounts for qualifying projects.
The limited number of permitted, construction-ready projects illustrates how difficult it has become to bring new gold supply to market. U.S. Gold Corp's CK Gold Project in Wyoming is fully permitted and feasibility-complete, reporting an after-tax net present value of about US$635 million and an internal rate of return just below 30% at its base-case gold price, while its permits are not revocable under Wyoming law.
Existing infrastructure can lower the capital cost and development timeline required to bring new mine supply online. Hycroft Mining's gold and silver project in Nevada reported a post-tax net present value of US$4.3 billion in its June 2026 Initial Assessment using a US$3,600 per ounce gold price. The study's sensitivity analysis increased that figure to US$10.0 billion at spot prices, although the higher estimate is based on a non-reserve assessment rather than a reserve-backed mine plan and should not be treated as a confirmed project value. Its existing crushing, heap-leach, and Merrill-Crowe processing facilities reduce the capital required relative to a comparable greenfield build.
Constrained Future Supply Meets Persistent Demand
A supply constraint supports gold valuations only if demand remains strong, and central banks continue to add to their gold holdings. The World Gold Council reports that central banks purchased an estimated 244 tonnes in the first quarter of 2026, that 89% of reserve managers expect official holdings to rise over the coming year, and that 74% expect the US dollar's share of global reserves to fall within five years. Reserve diversification can support gold demand over multiple years because central-bank purchases are driven by reserve-allocation decisions rather than short-term moves in interest rates.
Future supply is constrained by geology and long development timelines, while demand is supported by central-bank purchases that are driven by reserve-allocation decisions rather than short-term interest-rate expectations. Under those conditions, developer valuations depend more on jurisdiction, resource confidence, grade, and execution than on short-term moves in the gold price. This analysis does not rely on a specific long-term gold-price forecast, because the combination of constrained supply growth and continued central-bank demand supports the strategic value of projects positioned to supply the next decade.
The Investment Thesis for Gold
- Falling discoveries and longer development timelines increase the value of the development pipeline, because the metal the market needs next decade must come from projects being advanced today rather than from a rapid supply response to higher prices.
- Jurisdiction and permitting policy have become more important valuation drivers, because faster approvals and lower permitting risk can increase the value of development-stage projects by reducing delays and uncertainty.
- Resource confidence, grade, and metallurgy influence project financing, with higher-confidence ounces and lower-capital deposits generally easier to fund and develop than complex systems.
- Execution milestones can increase EV/oz valuations because resource estimates, Feasibility Studies, permitting, construction, and first production each reduce project risk and improve confidence in future cash flows.
- Falling discoveries and reserve depletion can support higher valuations for quality development assets, because producers often view advanced projects as a faster route to reserve replacement than new discoveries.
- Investors should maintain risk discipline, as production timelines are targets rather than guarantees, lead times can extend, economic studies remain subject to revision, and gold equities carry full risk of capital loss.
Two decades of declining discoveries, mine-development timelines approaching 16 years and beyond, limited production growth, and a finite reserve base constrain future supply, while continued central-bank buying supports long-term gold demand. For developers and explorers, which represent future mine supply, valuation depends primarily on jurisdiction, resource confidence, grade, and execution, with recent permitting reforms providing additional support for qualifying projects. The standing caveats hold throughout: targets are not outcomes, and capital is at risk.
TL;DR
Gold supply growth is constrained by a lack of major discoveries and long mine-development timelines. S&P Global records only five to six major discoveries since 2020 and none in 2023 or 2024, while mine-development timelines average about 16 years from discovery to production. The World Gold Council expects mine output to remain broadly flat, and the US Geological Survey estimates reserves equal to roughly 18 to 20 years of production if they are not replaced. A March 2025 US executive order naming gold a covered mineral and accelerating permitting could reduce development timelines for qualifying projects. Because developers and explorers represent future mine supply, their valuations depend more on jurisdiction, resource confidence, grade, and execution than on short-term moves in the gold price, while continued central-bank buying supports long-term gold demand.
FAQs (AI-Generated)
Analyst's Notes


Subscribe to Our Channel


.jpg)


.jpg)
Stay Informed