Gold’s 3% Pullback Tests Whether Record Central Bank Buying Can Sustain Upside


.png)
Gold falls 3% as Fed rate risk rises, while record central bank buying and slow mine growth support the longer-term demand outlook.
- Gold fell approximately 3% from its three-month high near $4,700 per ounce as the probability of a September Fed rate increase rose from about 33% to above 40%.
- Central banks purchased a net 289 tonnes of gold in the second quarter of 2026, the strongest second-quarter total on record and a 62% year-over-year increase, even as the average LBMA gold price fell 8% below the first quarter’s record.
- Global mine production increased just 2% year over year to 966 metric tons in the second quarter of 2026, limiting how quickly new supply can respond to elevated gold prices.
- Incremental gold discovery costs below $100 per ounce, compared with acquisition prices of approximately $500 to $600 per ounce, support allocating capital to established exploration programs that can add ounces more cheaply than mergers and acquisitions.
Fed Rate Odds Climb Above 40% & Real-Yield Risk Pushes Gold 3% Lower
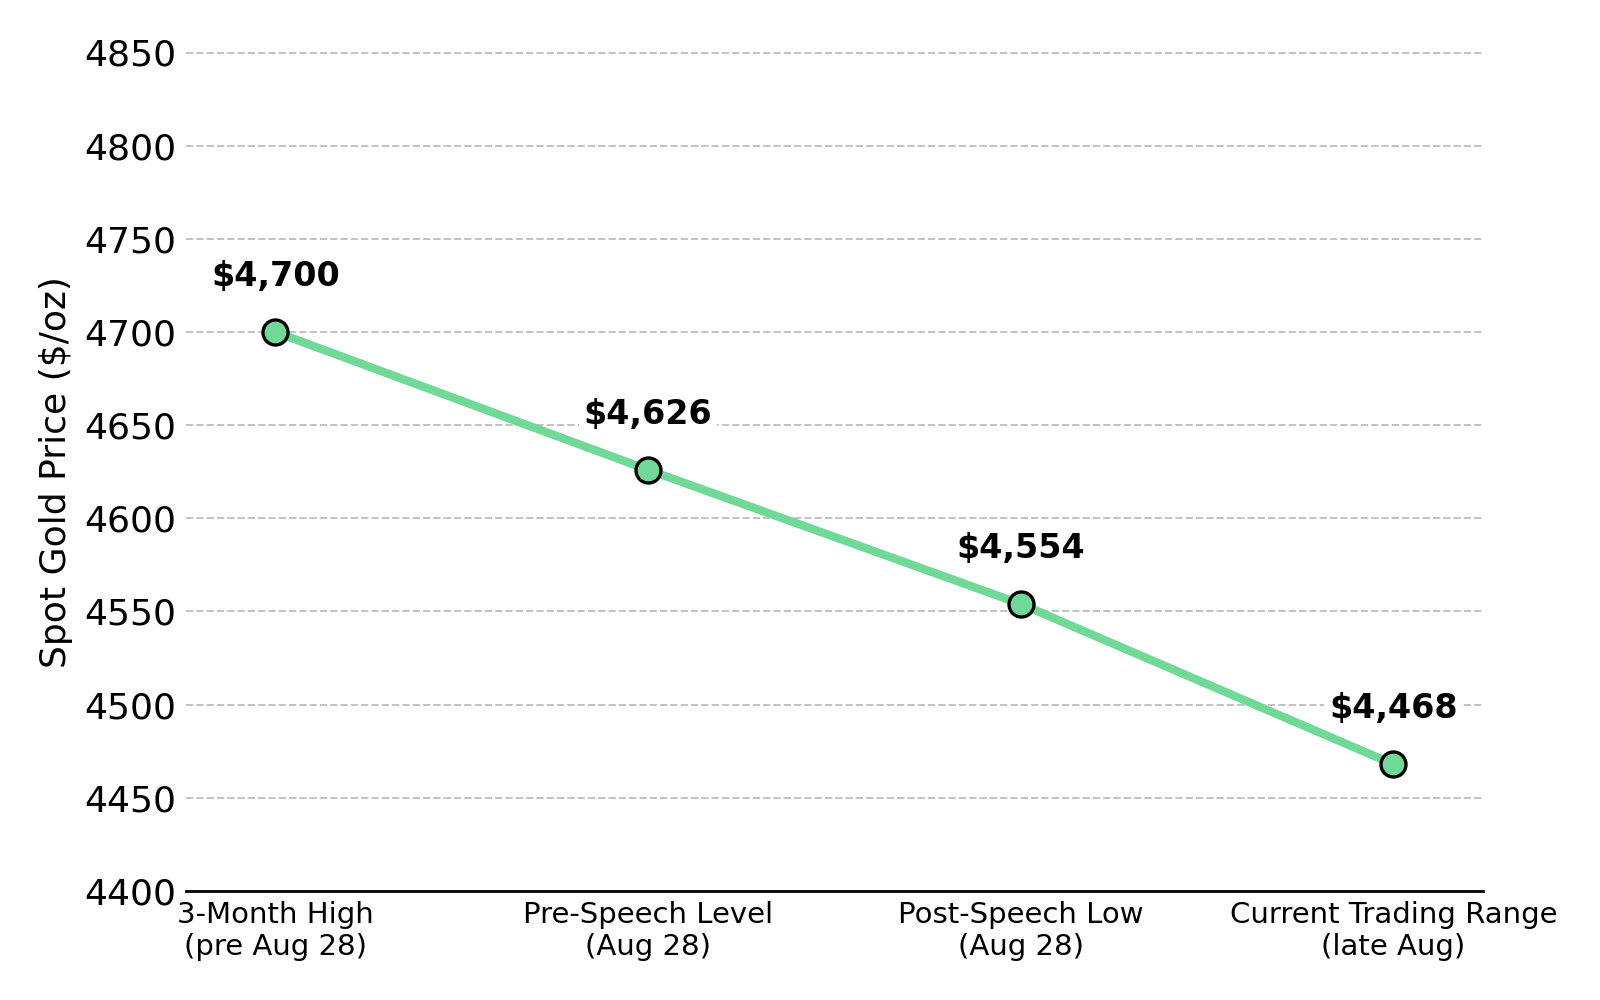
Fed Chair Kevin Warsh reaffirmed the Fed’s fixed 2% PCE inflation target and declined to provide guidance on the rate path during his first Jackson Hole address as chair on August 28, 2026, increasing uncertainty over near-term interest rates and pressuring gold. Spot gold fell approximately $72 within minutes, from nearly $4,626 per ounce to a low near $4,554, before reaching approximately $4,560 at the London afternoon benchmark.
CME FedWatch showed the probability of a rate increase at the Fed’s September 15 and 16, 2026 meeting rising from approximately 33% to more than 40% in the hours after Warsh’s address. Spot gold subsequently traded between $4,467 and $4,470 per ounce, approximately 3% below the three-month high near $4,700 reached several days earlier.
Gold pays no yield, so higher real yields increase the opportunity cost of holding it, redirecting capital toward interest-bearing government debt when rate expectations rise. Higher policy-rate expectations can raise real yields and redirect capital toward interest-bearing government debt, placing downward pressure on gold prices. The September inflation report, labor data, and Fed decision will test whether the post-Jackson Hole decline is a short-term repricing or the start of sustained pressure from higher real yields.
Lower Yields & a Weaker Dollar Support Gold as Fed Pressure Builds
On August 19, 2026, the US Treasury announced that it would double each long-dated bond buyback operation to at least $4 billion for securities maturing in 10 to 30 years, with purchases scheduled from September 9 through November 4, 2026. The expansion followed a Treasury-market selloff that pushed the 30-year yield to a 19-year high of 5.337%, while the buybacks are intended to improve market liquidity by purchasing less-liquid outstanding securities rather than reduce total federal debt.
Following the Treasury announcement, the 30-year yield declined from 5.337% toward 5.198%, while the US Dollar Index fell to 98.723, its lowest level since May 14, 2026. Lower Treasury yields can reduce gold’s opportunity cost when inflation expectations remain stable, while a weaker dollar lowers its cost for buyers using other currencies. In a dated research note that should be cited, Citi analysts linked the combination of a weaker dollar and large US fiscal deficits with increased demand for gold as a store of value outside government debt. Gold subsequently reached a three-month high near $4,700 per ounce before higher September rate expectations following Warsh’s August 28 address pushed it lower.
Treasury buybacks scheduled through November 4, 2026 may support liquidity in long-dated government bonds, but their effect on gold will depend on whether lower real yields and a weaker dollar offset the downward pressure from higher Fed rate expectations.
Central Bank Buying Equals 30% of Mine Output & Strengthens Gold’s Demand Base
The World Gold Council’s July 30, 2026 Gold Demand Trends report showed that central banks purchased a net 289 metric tons of gold in the second quarter, the strongest second-quarter total in the report’s data series and a 62% year-over-year increase. The purchases continued even as the average LBMA gold price was $4,506.29 per ounce, 8% below the record quarterly average set in the first quarter, showing that official demand increased during the price correction.
The World Gold Council identified Poland, China, Uzbekistan, Kazakhstan, and the Czech Republic among the quarter’s largest official buyers, showing that central-bank demand was distributed across several reserve managers rather than dependent on one country. By contrast, gold-backed exchange-traded funds recorded 45 metric tons of net outflows, concentrated in North America, while central-bank purchases exceeded those outflows by more than six to one.
The PBOC extended its gold-buying run to 21 consecutive months in July 2026, adding 19.9 metric tons in its largest monthly purchase since 2023 and lifting reported holdings to 76.08 million ounces. Gold remained below 10% of China’s foreign-exchange reserves, allowing further purchases to raise its allocation without making gold the country’s dominant reserve asset. Across all reporting central banks, second-quarter net purchases of 289 metric tons equaled approximately 30% of the quarter’s 966 metric tons of mine production, making official-sector demand significant relative to newly mined supply.
Mine Supply Grows Just 2% & Project Economics Determine Which Gold Ounces Reach Market
According to the World Gold Council, global mine production rose 2% year over year to 966 metric tons in the second quarter, supported by new output in Canada and Chile, while recycled supply fell 6%. Annual mine production reached a record 3,672 metric tons in 2025, but resource definition, feasibility studies, permitting, construction, and commissioning prevent supply from responding rapidly to higher prices. This delay allows higher gold prices to improve margins at operating mines before generating additional output, while increasing the financing relevance of projects already advancing through feasibility and permitting.
Sub-$100 Discovery Costs & $500-$600 Acquisition Prices Favor Drilling Over M&A
Lower discovery costs relative to acquisition prices can direct development capital toward drilling programs that add gold ounces without paying a takeover premium. New Found Gold is advancing Queensway in Newfoundland and Labrador alongside Hammerdown, which is targeting commercial production and future cash flow sufficient to cover continued exploration. Under the company’s current development budget, Queensway’s first phase is funded to first ore through a $220 million financing announced in April 2026.
New Found Gold Chief Executive Officer Keith Boyle quantified the difference between organic discovery and acquired ounces:
"When we look at the overall cost of finding new ounces, we're seeing a real decrease in that discovery cost. It was about $145 an ounce for that first resource, and now the additional ounces are dropping, we're sub-$100 now. If you look at M&A, the cost of adding ounces through M&A is upwards of 500 to 600 bucks an ounce now."
Gold Price Leverage Strengthen Development-Stage Project Economics
Permit delays postpone construction and revenue while extending project carrying costs, which can reduce both NPV and IRR. U.S. Gold Corp.’s March 2026 feasibility study reported an after-tax NPV of $632 million at a 5% discount rate and a 27% IRR using a base-case gold price of $3,250 per ounce.
U.S. Gold Corp Executive Chairman Luke Norman placed that base case against where the broader market was pricing gold:
"We ran $3,250 as our base case, which is significantly below consensus. Most analysts' consensus is pushing up around $3,800 an ounce. We start pushing up towards spot price in gold, and you can see a tremendous shift… Clearly most good deposits do in a higher gold price environment."
Cabral Gold is targeting first production at its development-stage Cuiú Cuiú district in Pará, Brazil, where the project’s pre-feasibility study models a life-of-mine AISC of $1,210 per ounce. At a gold price near $4,470 per ounce, that cost profile implies a margin of roughly $3,260 per ounce before taxes, royalties, sustaining capital adjustments, and other corporate costs, materially strengthening the project’s potential cash generation relative to the assumptions used in its study.
Metallurgical Recoveries Help Determine Which Gold Deposits Become Financeable
Copper-bearing gold deposits can remain undeveloped when soluble copper increases cyanide consumption, raising reagent costs and complicating the recovery of both metals. At its exploration-stage Gabbs project in Nevada, P2 Gold tested a sulfidization, acidification, recycling, and thickening process that separates copper from the leach solution and recycles cyanide for further use. Phase 3 metallurgical testwork achieved recoveries of 94.5% for gold and 79.9% for copper, improvements from the recovery assumptions in the project’s 2025 preliminary economic assessment.
Tudor Gold, which holds an 80% interest in the development-stage Treaty Creek project in British Columbia’s Golden Triangle, is evaluating whether flotation recoveries can support a selective underground development plan. Metallurgical testing returned recoveries of 85.8% for copper and 85.1% for gold from the CS600 and SC-1 zones, supporting further evaluation of a higher-grade underground scenario instead of a bulk-tonnage open-pit design.
Metallurgical recoveries of 85.1% for gold and 85.8% for copper could improve payable metal output and revenue per tonne processed, strengthening potential margins and project value if those recoveries are maintained at scale.
September Payrolls, CPI & Fed Decision Test Whether Gold’s 3% Pullback Deepens
The August US Employment Situation report will test whether gold’s post-Jackson Hole decline is a short-term correction or the start of continued pressure from higher real yields. Scheduled for September 4, 2026, the report is the final monthly labor-market release before the Fed’s September 15 and 16 meeting. After nonfarm payrolls contracted by 23,000 jobs in July, another result below the market consensus could reduce the probability of a September rate increase and support gold, while an above-consensus result could raise rate expectations and extend the price decline.
The August Consumer Price Index report, scheduled for September 10, 2026, and the Fed’s September 15 and 16 policy decision will test whether current expectations for higher rates are supported by inflation data and the Fed’s updated guidance. Changes in nominal Treasury yields and expected inflation following those events could alter real yields, affecting gold’s opportunity cost and its near-term price in US dollars.
The longer-term gold thesis depends on three measurable demand and currency signals. Continued monthly PBOC purchases would sustain official-sector demand, while a reversal of second-quarter North American ETF outflows in the third quarter would restore a source of Western demand. The US Dollar Index through the Treasury buyback program’s November 4, 2026 end date will show whether foreign-currency buyers continue receiving support from a weaker dollar.
The Investment Thesis for Gold
- Central banks purchased a net 289 metric tons of gold in the second quarter of 2026, up 62% year over year, while buying across Poland, China, Uzbekistan, Kazakhstan, and the Czech Republic reduced reliance on any single reserve manager.
- A September rate-increase probability above 40% could raise real yields and pressure gold, while Treasury buybacks through November 4, 2026 may support bond-market liquidity without guaranteeing lower yields or a weaker dollar.
- Global mine production increased only 2% year over year in the second quarter of 2026, increasing the financing relevance of feasibility- and permitting-stage projects that can reach production sooner than early-stage exploration assets.
- Incremental discovery costs below $100 per ounce, compared with acquisition prices of approximately $500 to $600 per ounce, make established drilling programs a lower-cost route to adding gold resources than mergers and acquisitions.
- Permit delays postpone construction and revenue while extending carrying costs, reducing NPV and IRR, while issued permits lower schedule risk for projects seeking construction financing.
- SART testwork increased gold recovery from 85% to 94.5% and copper recovery from 67% to 79.9%, but feasibility studies must still demonstrate whether those improvements support a financeable mine plan.
Changes in Fed rate expectations can move gold over days by altering real yields, the dollar, and the opportunity cost of holding a non-yielding asset. Central banks purchased 289 metric tons in the second quarter of 2026, equal to approximately 30% of quarterly mine production, while mine output increased only 2% year over year. September labor data, inflation figures, and the Fed decision will influence near-term rate pressure, while discovery costs, permitting schedules, metallurgical recoveries, and financing terms will determine how quickly new gold projects can add supply.
TL;DR
Gold fell approximately 3% from its three-month high as September rate-increase odds rose above 40%, raising the risk of higher real yields. However, central banks purchased a record 289 metric tons in the second quarter of 2026, equal to about 30% of quarterly mine production, while mine output grew only 2% year over year. Lower yields and a weaker dollar may support gold, but September payrolls, inflation data, and the Fed decision will shape its near-term direction. For new supply, discovery costs, permitting timelines, metallurgical recoveries, and financing terms will determine which projects reach production.
FAQs (AI-Generated)
Analyst's Notes





Subscribe to Our Channel











.jpg)

Stay Informed