
3.4% US GDP Growth Reprices Fed Outlook as Gold Mine Output Hits Record



Stronger US growth reinforces restrictive Fed expectations, pressuring gold prices as record mine output and rising costs put operating efficiency in focus.
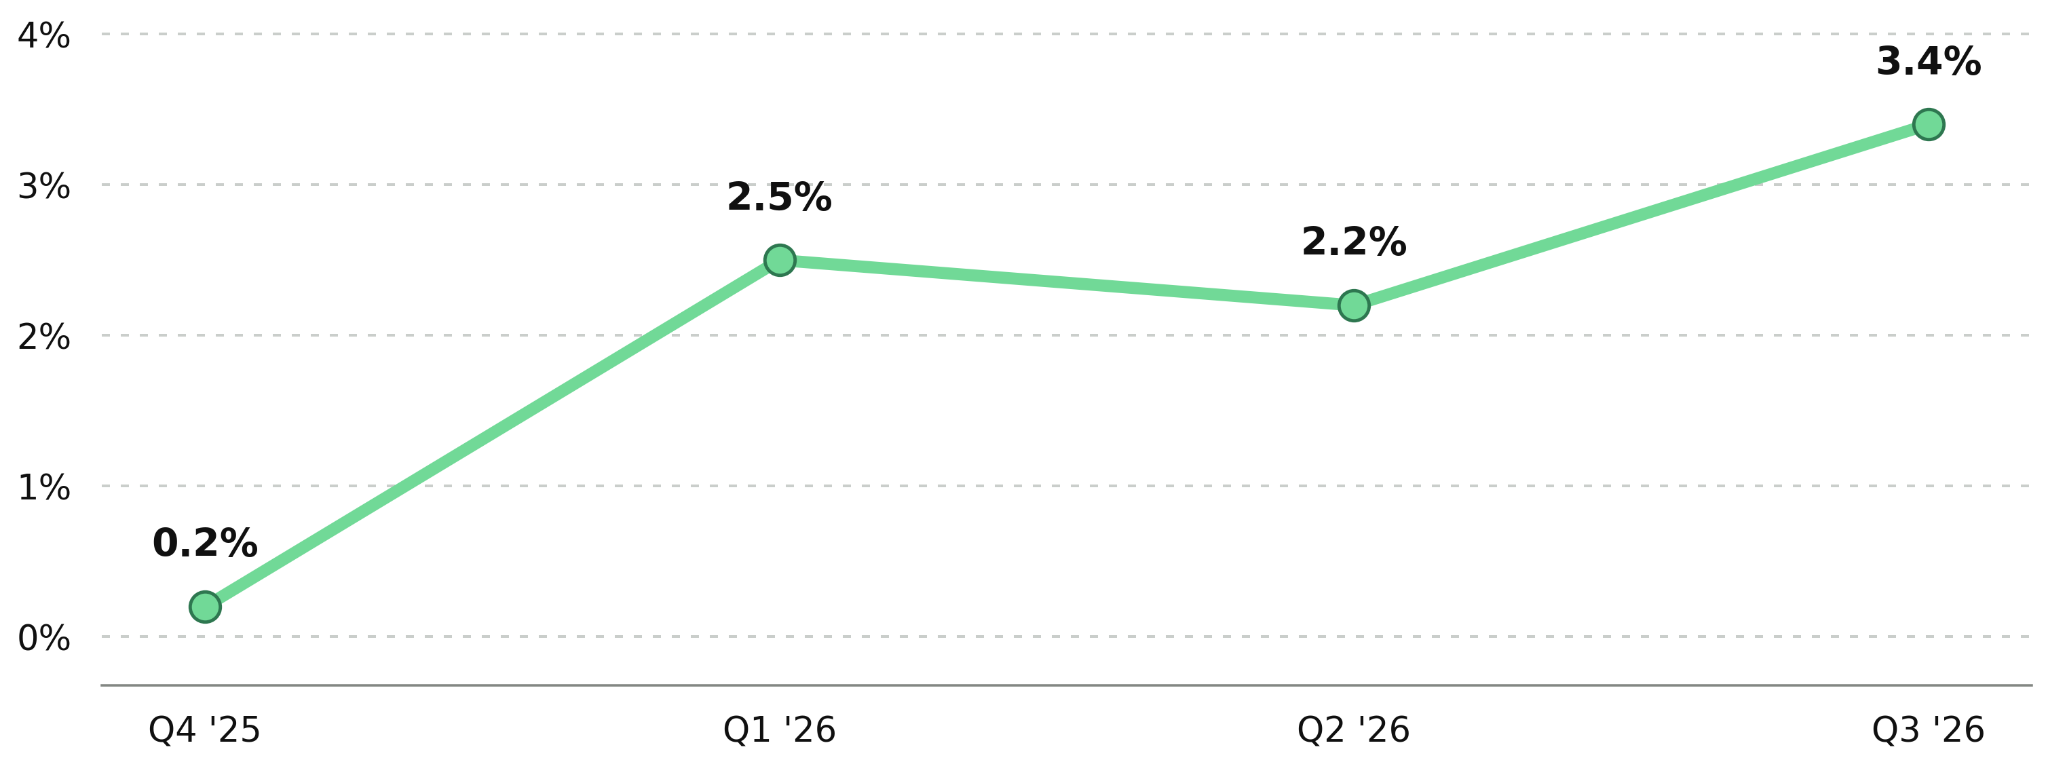
- US gross domestic product (GDP) grew at an annualized 3.4% in the third quarter of 2026, up from 2.2%, while September personal consumption expenditures (PCE) inflation reached 3.6%, reinforcing expectations of restrictive Fed policy.
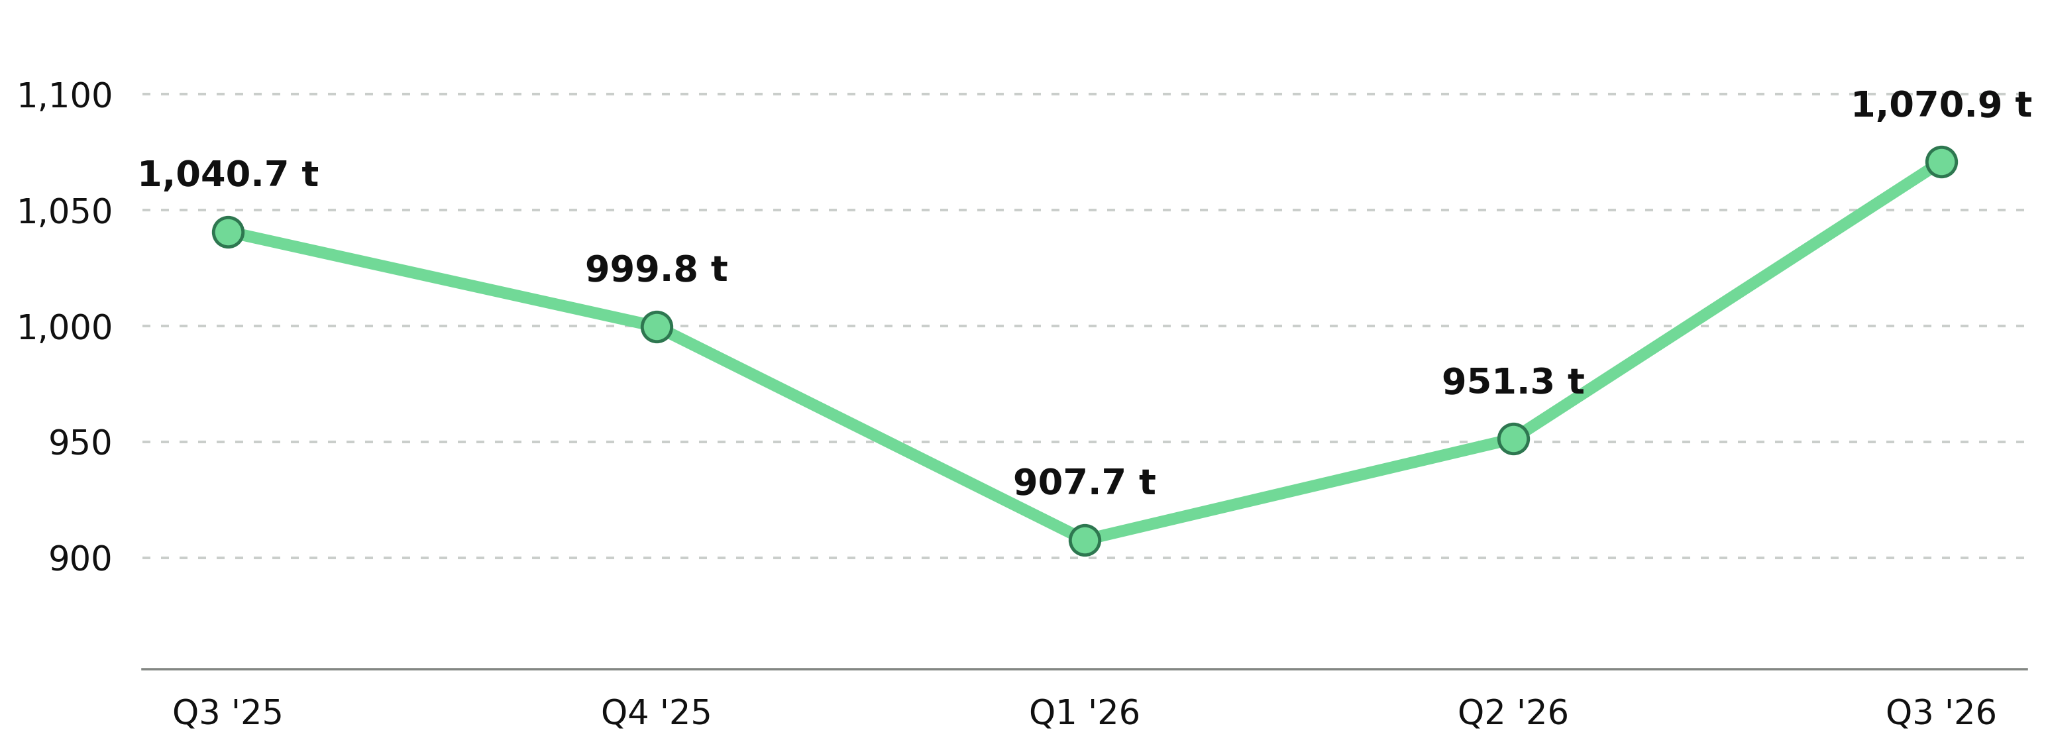
- Global mine production increased 3% year over year to a third-quarter record of 1,071 tonnes, supporting physical gold supply despite a decline in recycling activity.
- World Gold Council (WGC) reports that Fed repricing coincided with a combined reduction of approximately 70 tonnes across three COMEX futures-position categories.
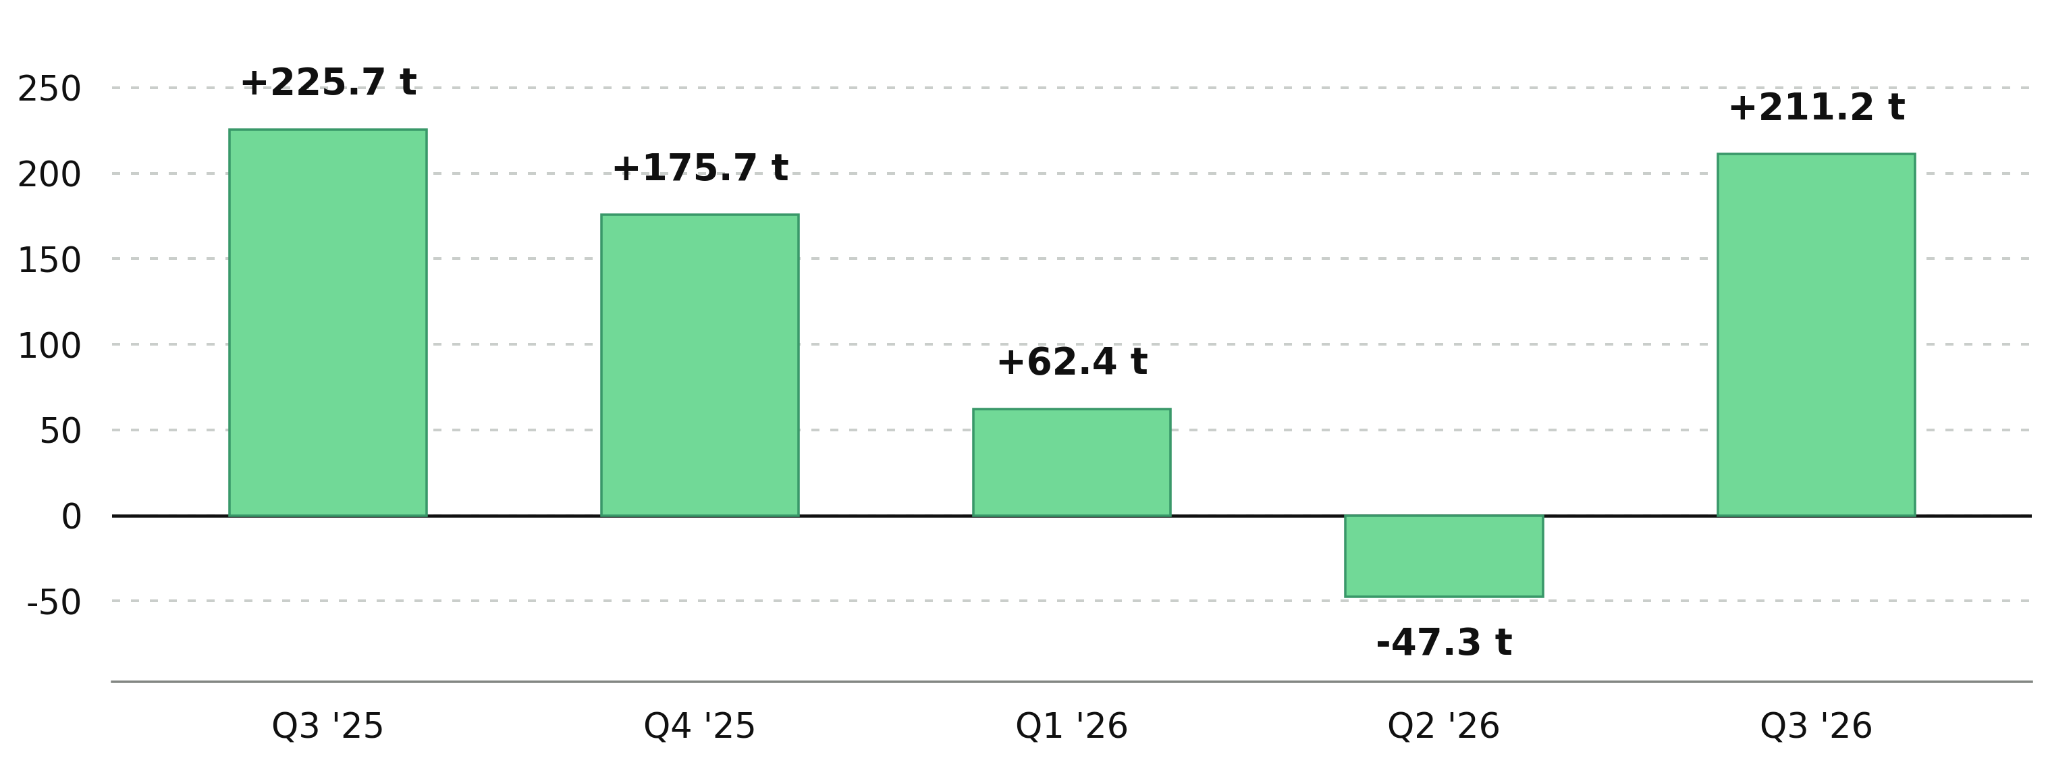
- Gold exchange-traded funds (ETFs) attracted 211 tonnes and a record US$31 billion in third-quarter inflows, while central-bank gold purchases reached an estimated 321 tonnes.
- Industry all-in sustaining costs (AISC) rose 22% year over year to US$1,930 per ounce in the second quarter, increasing the importance of mining efficiency and profitable gold recovery.
US Growth Reinforces Fed Restraint & Pressures Gold
US GDP expanded at an annualized 3.4% in the third quarter of 2026, up from 2.2% in the second quarter, according to the Bureau of Economic Analysis (BEA). September PCE inflation reached 3.6% year over year, up from 3.4% in August, while core PCE inflation stood at 3.1%. Stronger economic growth and higher inflation reinforced expectations of restrictive Fed policy.
The Fed maintained its benchmark interest rate at 3.75% to 4.00% on October 28, with two committee members favoring a 25-basis-point increase. Gold stood at approximately US$3,913 per ounce on October 30, down 2.5% for the week. WGC linked part of the decline to expectations of a more restrictive Fed rate path and renewed interest in government bonds, which pay interest while gold does not.
COMEX data for October 27 showed combined reductions of approximately 70 tonnes across three futures-position categories. These reductions reflected changes in futures positions rather than physical gold sales and preceded the GDP and PCE releases.
Institutional Buying Sustains Demand Despite Rate Pressure
WGC recorded third quarter gold demand of 1,369 tonnes, down 1% year over year, while demand value increased 22% to US$188 billion. Physically backed gold ETFs attracted 211 tonnes in record inflows of US$31 billion, reversing second-quarter outflows of 47 tonnes and lifting global holdings to a record 4,256 tonnes. European-listed ETFs contributed 92 tonnes of inflows, while North American funds added 81 tonnes, with global ETF accumulation reaching 120 tonnes in August alone.
Central banks purchased an estimated 321 tonnes of gold during the third quarter, up 42% year over year and bringing nine-month purchases to 675 tonnes. WGC separately recorded 61 tonnes of publicly reported purchases in September, the highest monthly disclosed total of 2026. ETF inflows and central-bank purchases supported gold demand, even as restrictive Fed expectations weighed on prices and futures positioning.
Record Mine Output Limits Gold Supply Decline
Global gold mine production increased 3% year over year to a third-quarter record of 1,071 tonnes. This growth highlights the contribution of operating mines to physical gold supply, particularly where improved recovery rates and processing efficiency translate into higher production.
Mineros S.A. increased third-quarter 2026 gold production by 14% year over year to 62,565 ounces, supported by higher output at Hemco and improved recoveries at Nechí. Gold sales rose 11.7% to 61,281 ounces, while nine-month production reached 181,466 ounces. These results prompted a second increase in full-year production guidance to 235,000-245,000 ounces, reflecting stronger performance across its existing operations.
Daniel Henao, President and Chief Executive Officer of Mineros S.A., contrasts producers' positive gold outlook with bullion sales:
"As mining companies, we're always talking about how constructive our views are on gold. Yet the first thing we do when we produce the metal is change it for paper."
Higher Ore Volumes Lift Heap-Leach Production
Indonesian gold production increased 21% year over year in the third quarter, partly driven by higher ore grades and mining volumes. These improvements demonstrate how greater mining activity and higher-grade material can support increased gold output, particularly at operations using heap-leach processing.
Integra Resources increased third-quarter 2026 gold production at Florida Canyon to 17,652 ounces, up 8% from the second quarter and 40% from the first. Ore mined rose 21% quarter over quarter, while processed gold grades improved 9%, supporting continued production growth and the company's full-year guidance of 70,000-75,000 ounces. With US$119.5 million in cash at September 30, the company has funding capacity for further operating improvements and project advancement.
Rising Mining Costs Increase Recovery's Value
Average AISC reached a record US$1,930 per ounce in the second quarter of 2026, increasing 22% year over year. Higher energy and consumable costs, alongside sustaining capital spending contributed to the rise, strengthening the importance of processing improvements and higher gold recovery in supporting operating margins.
TRX Gold increased fiscal 2026 gold production by 57% year over year to a record 29,650 ounces, reaching the upper end of its annual guidance, with fiscal fourth-quarter output of 8,173 ounces. Upgrades to Buckreef's existing processing plant improved throughput and gold recovery, supporting higher production and expected revenue growth. A contracted 3,500-tonne-per-day processing circuit provides a path to further production expansion.
Stephen Mullowney, Director and Chief Executive Officer of TRX Gold, explains how ore grades affect production costs:
"The grade profile will fluctuate over time so you'll get more expensive ounces at lower grade profile and cheaper ounces at the higher grade profile. So you have to look at your per ton metrics on cost."
Existing Mills Support Expansion Without New Facilities
Canadian gold mine production increased 22% year over year in the third quarter, while Chilean output rose 19%, supported by new operations and higher production at existing mines. These gains highlight how established mining districts can expand gold supply by utilizing existing infrastructure and increasing processing capacity.
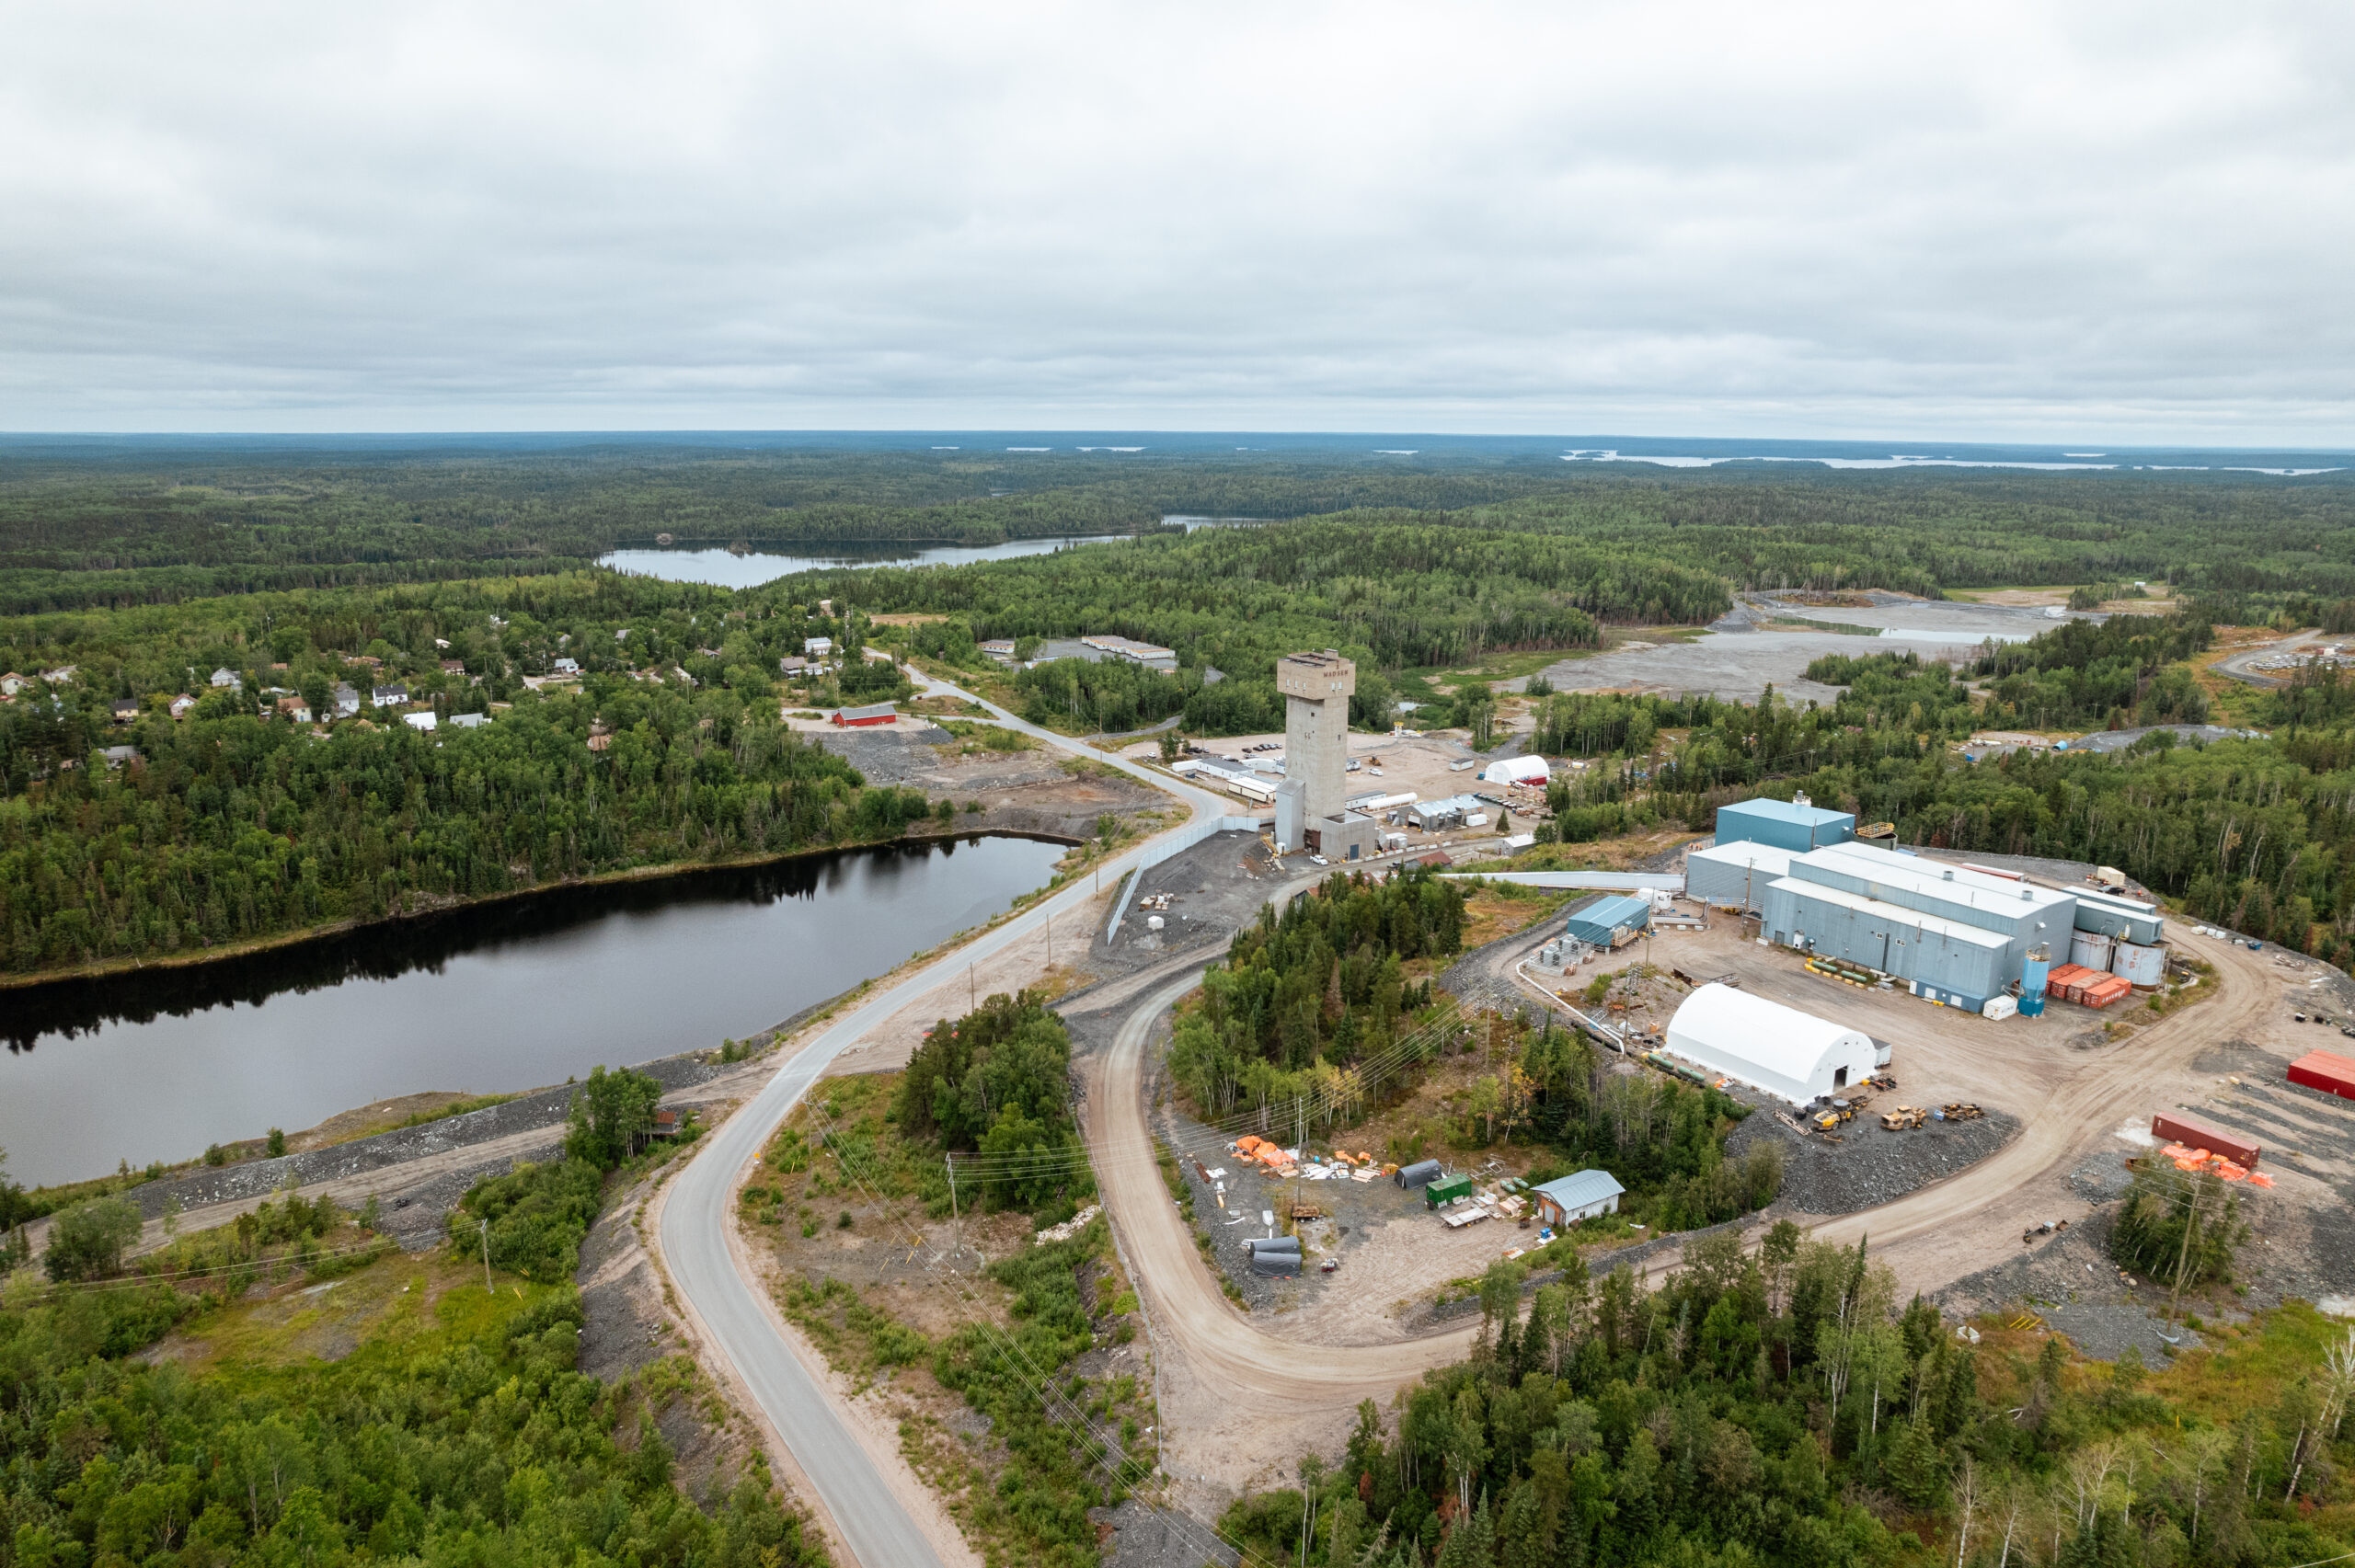
West Red Lake Gold Mines produced 7,859 ounces at Madsen in the third quarter of 2026, bringing nine-month output to 22,102 ounces, with September recording its strongest monthly production since the mine's restart. Its pre-feasibility study projects average annual production of 108,000 ounces from 2029 to 2034 by processing Rowan ore at the existing Madsen mill. The November 4 integrated pre-feasibility study estimates an after-tax net present value at a 5% discount rate (NPV5%) of C$764 million under its base-case gold price assumptions, including US$3,568 per ounce from 2030 onward.
Shane Williams, President and Chief Executive Officer of West Red Lake Gold Mines, explains how higher gold prices affect mine supply:
"Gold price is an important factor… With the increasing gold price, cut-off grade can come down a lot more, which allows a lot more material and allows us to switch to that long-hole mining."
Ore Access Determines Production Growth
Australian gold production declined 12% year over year in the third quarter, while US output fell 7%, partly reflecting lower-grade mine sequencing. These trends highlight the importance of accessing higher-grade ore and expanding processing capacity to support gold production.
Serabi Gold produced 34,057 ounces of gold during the first nine months of 2026, including 23,089 ounces from Coringa, where milled ore averaged 7.74 grams of gold per tonne. The fourth ball mill at Palito is in final commissioning, supporting planned annual processing capacity of 330,000 tonnes in 2027. Pending operating approvals would allow more Coringa ore to reach the expanded plant, supporting future production growth. With US$63.2 million in cash and no debt, the company maintains financial flexibility for further operational investment.
Available Capital Supports Processing Expansion
Global gold mine production increased approximately 2% during the first nine months of 2026, with mining expected to remain a key source of additional supply. As Fed expectations influence financing conditions, available capital and existing processing infrastructure can support higher gold recovery and future production growth while reducing the need for new facilities.
New Found Gold is producing gold at its Hammerdown mine, which supplies approximately 700 tonnes of ore per day to the operating Pine Cove mill. Ongoing processing upgrades target an increase in gold recovery from approximately 85%-87% to around 92%, improving the amount of gold recovered from existing ore. With approximately C$167 million in cash, the company is also expanding its processing capacity to accommodate Queensway ore, targeting initial deliveries in the fourth quarter of 2027.
Lower Recycling Increases Reliance on Mine Supply
Recycled gold supply declined 8% year over year to approximately 314 tonnes in the third quarter of 2026, its lowest level since late 2023. This reduction increases the importance of mine production in maintaining physical gold supply, particularly as newly commissioned operations advance toward commercial production.
Cabral Gold achieved its first gold pour at Cuiú Cuiú in Brazil and is targeting commercial production in the fourth quarter of 2026. Its initial operation processes near-surface oxide material without crushing or grinding, supporting a targeted AISC of approximately US$1,200 per ounce. The company is evaluating a potential doubling of processing throughput within 12 months, while continued drilling and a planned resource update support further assessment of the district's gold resources.
Fed Pressure Shifts Focus to Mine Execution
Stronger US economic growth and higher inflation reinforced expectations of restrictive Fed policy, weighing on gold prices and futures positioning. However, gold demand reached 3,881 tonnes during the first nine months of 2026, nearly matching the 3,884-tonne record in 2025, while demand value reached US$566 billion. Investment demand, supported by ETF allocations and central-bank purchases, is projected to be the main contributor to annual demand growth.
On the supply side, third-quarter mine production reached a record 1,071 tonnes, while industry AISC rose 22% year over year to US$1,930 per ounce in the second quarter. These conditions reinforce the importance of production growth, efficient gold recovery, cost competitiveness, and disciplined capital deployment in assessing gold mining exposure.
The Investment Thesis for Gold
- Central-bank reserve diversification and institutional gold allocations support demand beyond short-term changes in leveraged futures positioning.
- Fed rate expectations influence gold's attractiveness relative to interest-bearing assets, affecting capital allocation to the commodity.
- Producers with rising output and improving gold recoveries can strengthen operating performance, making production volumes and margins important measures of mining exposure.
- Higher mining costs increase the importance of ore grades, processing efficiency, and disciplined sustaining capital spending in protecting operating margins.
- Existing processing infrastructure supports additional gold production while reducing the need for new construction and associated capital expenditure.
- Capital availability and disciplined funding decisions support production expansion, particularly when Fed expectations influence borrowing costs and project financing.
Fed rate expectations continue to influence gold's near-term pricing, while central-bank purchases and ETF allocations support demand beyond short-term futures positioning. Rising mining costs increase the importance of production growth, higher gold recoveries, and disciplined capital deployment in supporting operating performance. As monetary-policy expectations shift, the ability to increase recovered gold through efficient processing and effective use of existing infrastructure remains a measurable source of value in gold mining exposure.
TL;DR
Stronger US economic growth and higher inflation reinforced expectations of restrictive Fed policy, pressuring gold prices and contributing to changing market expectations. Despite this pressure, ETF inflows and central-bank purchases continued supporting gold demand, even as futures positions declined. Global mine production reached a third-quarter record, helping maintain physical supply amid lower recycling activity. However, rising mining costs increased the importance of gold recovery, processing efficiency, and disciplined capital deployment. For gold producers, higher output, effective use of existing infrastructure, and controlled operating costs remain important measures of performance as monetary-policy expectations continue influencing the commodity's investment outlook.
FAQs (AI-Generated)
Analyst's Notes





Subscribe to Our Channel












Stay Informed