‘Undervalued?’: The Commodities the Market is Watching Next


Gold, copper, and silver show different 2026 fundamentals, and mining equity value depends as much on execution as on commodity prices.
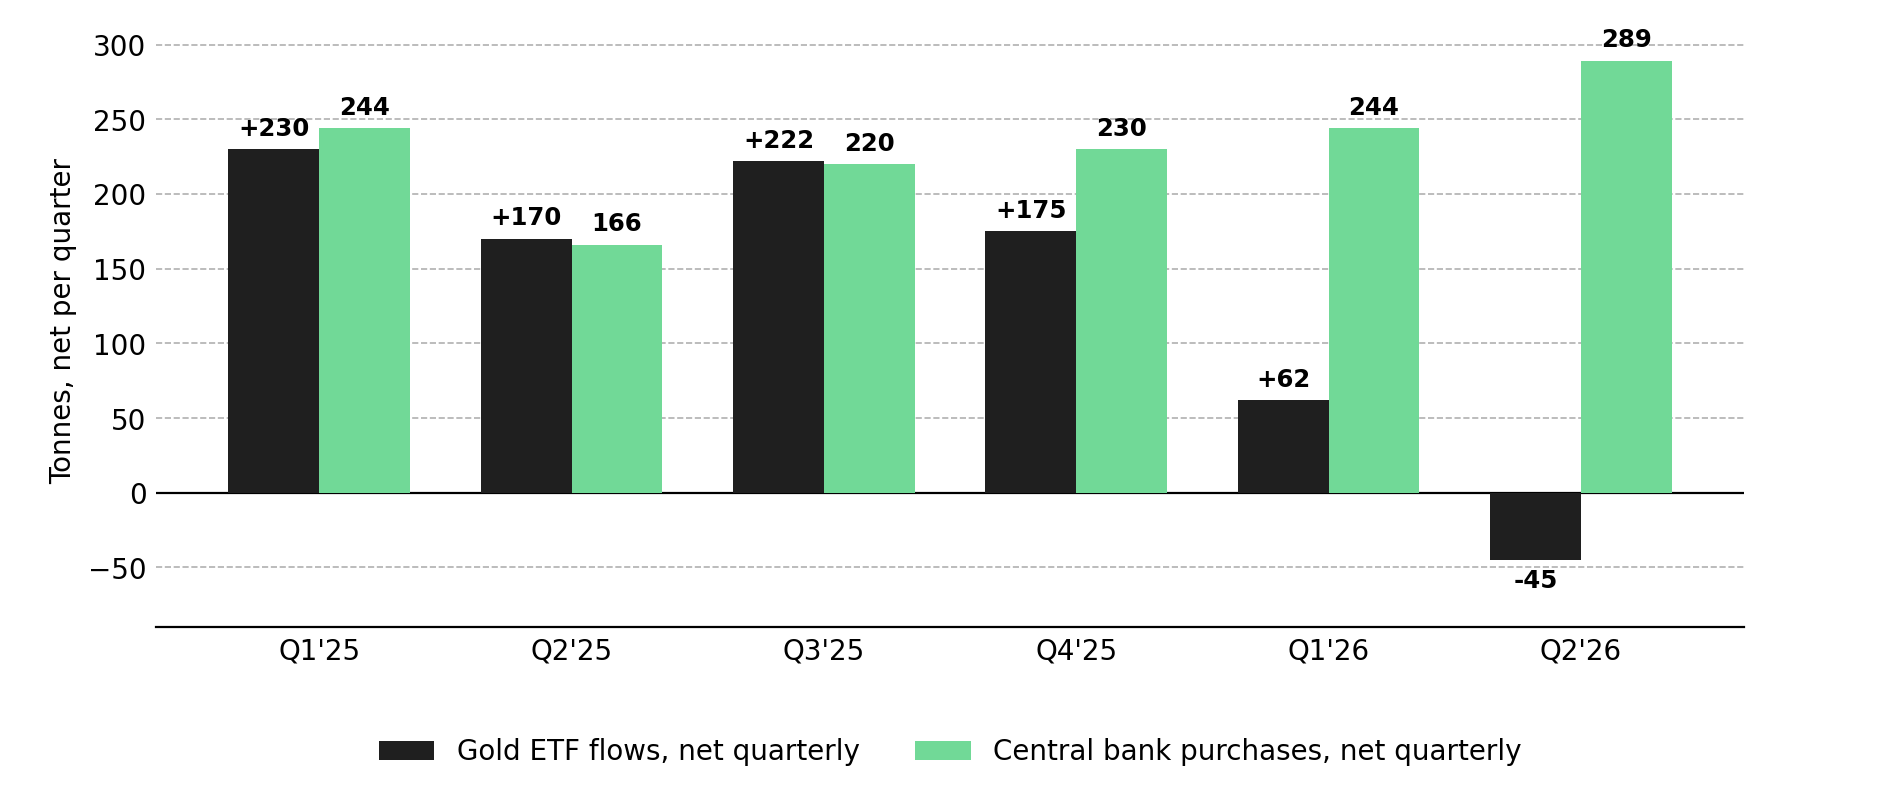
- Gold's demand picture is strong but not one-directional. First-half 2026 demand rose 2% year-over-year to a record US$380 billion in value, driven by central bank buying, yet ETF investors pulled 45 tonnes in Q2, showing that a high gold price alone doesn't make every gold equity a buy.
- Copper's supply gap is real and widening. The IEA projects a 25% shortfall by 2035 based on the current project pipeline. That scarcity raises the value of copper exposure, but only for projects that can actually secure financing and reach construction.
- Silver remains structurally undersupplied, but the story is more nuanced than the deficit headline. A sixth consecutive annual deficit is forecast for 2026, even as industrial demand falls on weaker solar-panel silver intensity — meaning investment demand, not industrial demand, is now doing more of the work.
- A rising commodity price can mask a weak project's real risks before they change. Higher prices lift NPV and IRR on paper, but they don't fix poor metallurgy, high capital intensity, unresolved permits, or a history of missed operating targets; they just delay when the market notices.
- Commodity strength sets the size of the opportunity; company execution decides who captures it. The widest re-rating potential sits where improving commodity fundamentals meet a specific, measurable de-risking event: a resource update, a feasibility study, a construction milestone, or a permit.
Gold Demand Is Strong, but the Equity Case Is Not Uniform
World Gold Council data illustrate why high gold prices alone do not constitute a uniform bull case for gold equities. First-half 2026 demand reached 2,522 tonnes, up 2% year over year, and the value of that demand reached a record US$380 billion. Central banks purchased 289 tonnes during the second quarter, 62% more than a year earlier, although first-half official-sector purchases of 345 tonnes were the lowest for a first half since 2022. At the same time, second-quarter gold exchange-traded fund holdings fell by 45 tonnes.
Higher gold prices increase the revenue available per recoverable ounce, which can lift NPV and IRR or shorten the projected capital payback period. They can also lift wages, contractor rates, equipment costs and competition for skilled personnel, meaning the margin benefit depends on how rapidly costs move relative to gold. Investors need to distinguish resource scale from economic ounces. Grade expressed in grams of gold per tonne, or g/t Au, recovery, strip ratio, processing cost, and cut-off grade determine which ounces can enter an economic mine plan.
A rising metal price can therefore make a project look substantially more valuable before the probability of actually delivering that value has changed. Dan Wilton, Chief Executive Officer of First Mining Gold, describes why development-stage assets can become particularly sensitive to this distinction:
“The best risk-reward investments that we've seen in the mining business have been in developers because you understand the resource, you generally have enough information that you understand the metallurgy... You may not have all the answers, but you've at least got 80% of the answers on 90% of the things that you need answers on.”
Omai Gold Mines hosts 2.5 million ounces of indicated gold at 2.04 g/t and 5.5 million ounces inferred at 1.59 g/t, with metallurgical recoveries of up to 92%. The company is at a stage where its large resource base can begin to be tested against potential economics. While higher gold prices improve the value of these ounces, the key re-rating driver is an updated preliminary economic assessment that will define how much of the resource can be mined economically and at what scale.
Capital Intensity Still Sets Development Value
As projects advance, resource uncertainty declines, and capital allocation becomes more important. Vista Gold’s recent feasibility study reduced planned throughput to 15,000 tonnes per day and initial capital to US$425 million, 59% below the company's previous 50,000-tonne-per-day development case. At US$2,500/oz gold, the revised study calculated an after-tax NPV at a 5% discount rate of US$1.1 billion and an IRR of 27.8%.
The financing mechanism matters because a technically strong NPV can still remain inaccessible if initial capital materially exceeds a company's ability to raise equity and debt without excessive dilution. Fred Earnest, President & CEO of Vista Gold, identified that constraint directly:
“Initial capital was a huge obstacle for us a couple of years ago… a billion dollar capex... By right-sizing the project and getting the capex down, this is something we can finance and build ourselves today.”
Copper's 25% Supply Gap Rewards Projects That Can Actually Be Built
The International Energy Agency's July 2026 outlook projects that the current mine pipeline could leave copper supply approximately 25% below demand by 2035. The gap reflects the difficulty of developing sufficient new production capacity despite projects advancing in countries such as the Democratic Republic of Congo and Zambia.
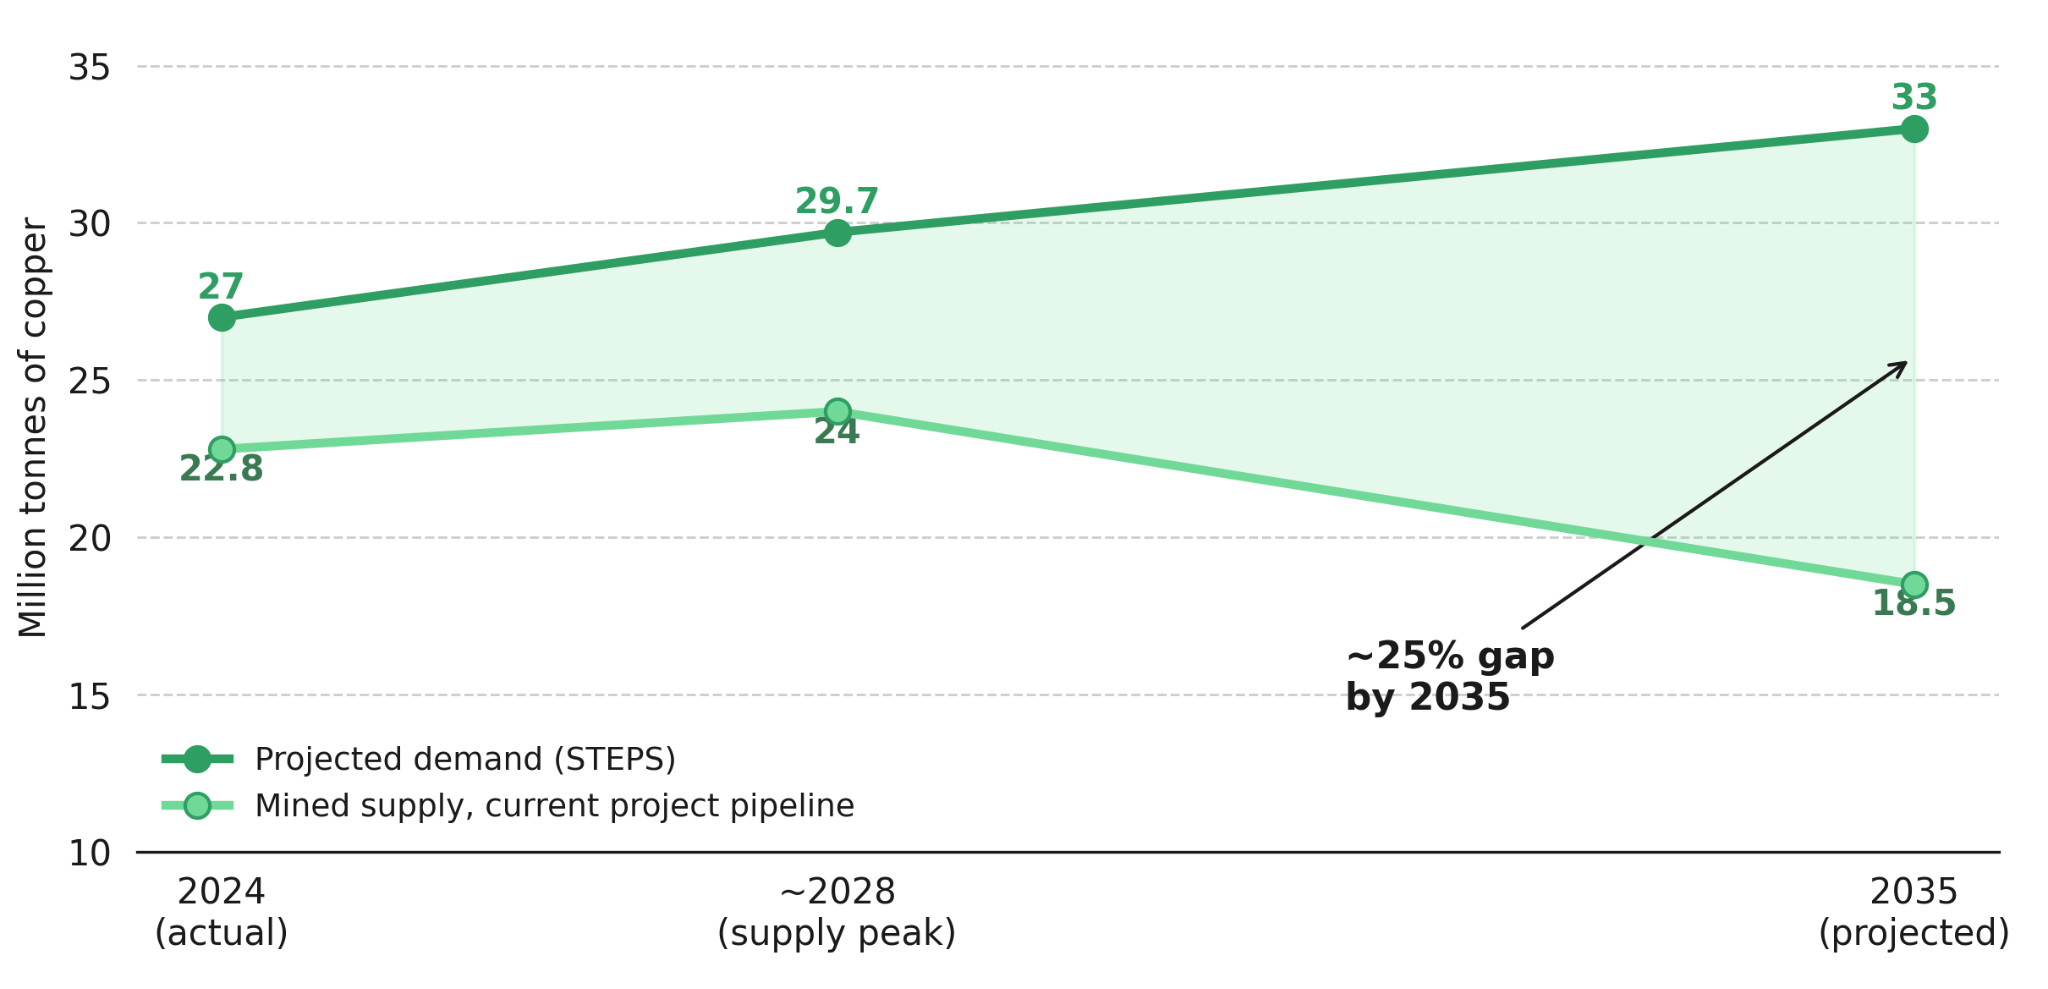
Electrification, grid expansion, and data-center infrastructure support demand, while declining grades, long permitting periods, and rising capital requirements limit how quickly new mine supply can respond.
Supply deficits increase the value of supply exposure, but investors still need to distinguish among companies by cost structure, capital requirements, and the timing of potential production. Marimaca Copper's definitive feasibility study targets approximately 50,000 tonnes of copper cathode production annually over a 13-year reserve life. At a US$4.30/lb copper assumption, the study calculated a post-tax NPV of US$709 million at an 8% discount rate, a post-tax IRR of 31%, and initial capital of US$587 million.
Stronger copper prices increase margins and prospective cash flow, but the investment case still depends on whether a project can fund and construct a mine within the feasibility study's capital and operating assumptions.
Commodity scarcity does not remove financing, permitting or jurisdiction risk. Hayden Locke, Chief Executive Officer of Marimaca Copper, identifies the mechanism behind persistent junior-miner discounts:
“Earlier stage obviously lacking studies and technical de-risking milestones… Funding is a huge one, and I often say that there are companies that are trading with a market cap that is a fraction of their total financing, and that's really the market telling you that they don't believe that you can finance this story yourself.”
Gold-Copper-Silver Exposure Can Improve Economics, but Credits Must Be Recoverable
Polymetallic projects can provide additional commodity leverage because copper or silver revenue can offset gold production costs, but a metal has no economic value merely because it appears in a resource estimate. It must be recoverable through the selected flowsheet, converted into a product and receive acceptable payability after treatment, refining, transport and marketing charges. Complex metallurgy or concentrate specifications can therefore offset some of the apparent diversification benefit.
U.S. Gold Corp used base-case assumptions of US$3,250/oz gold, US$4.50/lb copper and US$40/oz silver. The CK feasibility study calculated an after-tax NPV at a 5% discount rate of US$632 million, a 27% IRR and an initial capital of US$394 million, excluding US$26 million of pre-production owner's costs. When copper and silver are treated as by-products, the study reports life-of-mine gold AISC of US$1,094/oz, showing how payable secondary metals can reduce reported unit costs.
Tudor Gold remains at an earlier point in the same valuation process. Its 2026 Goldstorm mineral resource at Treaty Creek contains an indicated 24.9 million ounces of gold, 148.7 million ounces of silver and 3.048 billion pounds of copper, based on 912.3 million tonnes grading 0.85 g/t gold, 5.07 g/t silver and 0.15% copper. The scale is material, but the investment value of the copper and silver exposure will increasingly depend on future mine design, metallurgical recovery, cut-off grades and capital requirements rather than contained metal alone.
Silver's Deficit Supports Prices, but Operations Determine Equity Leverage
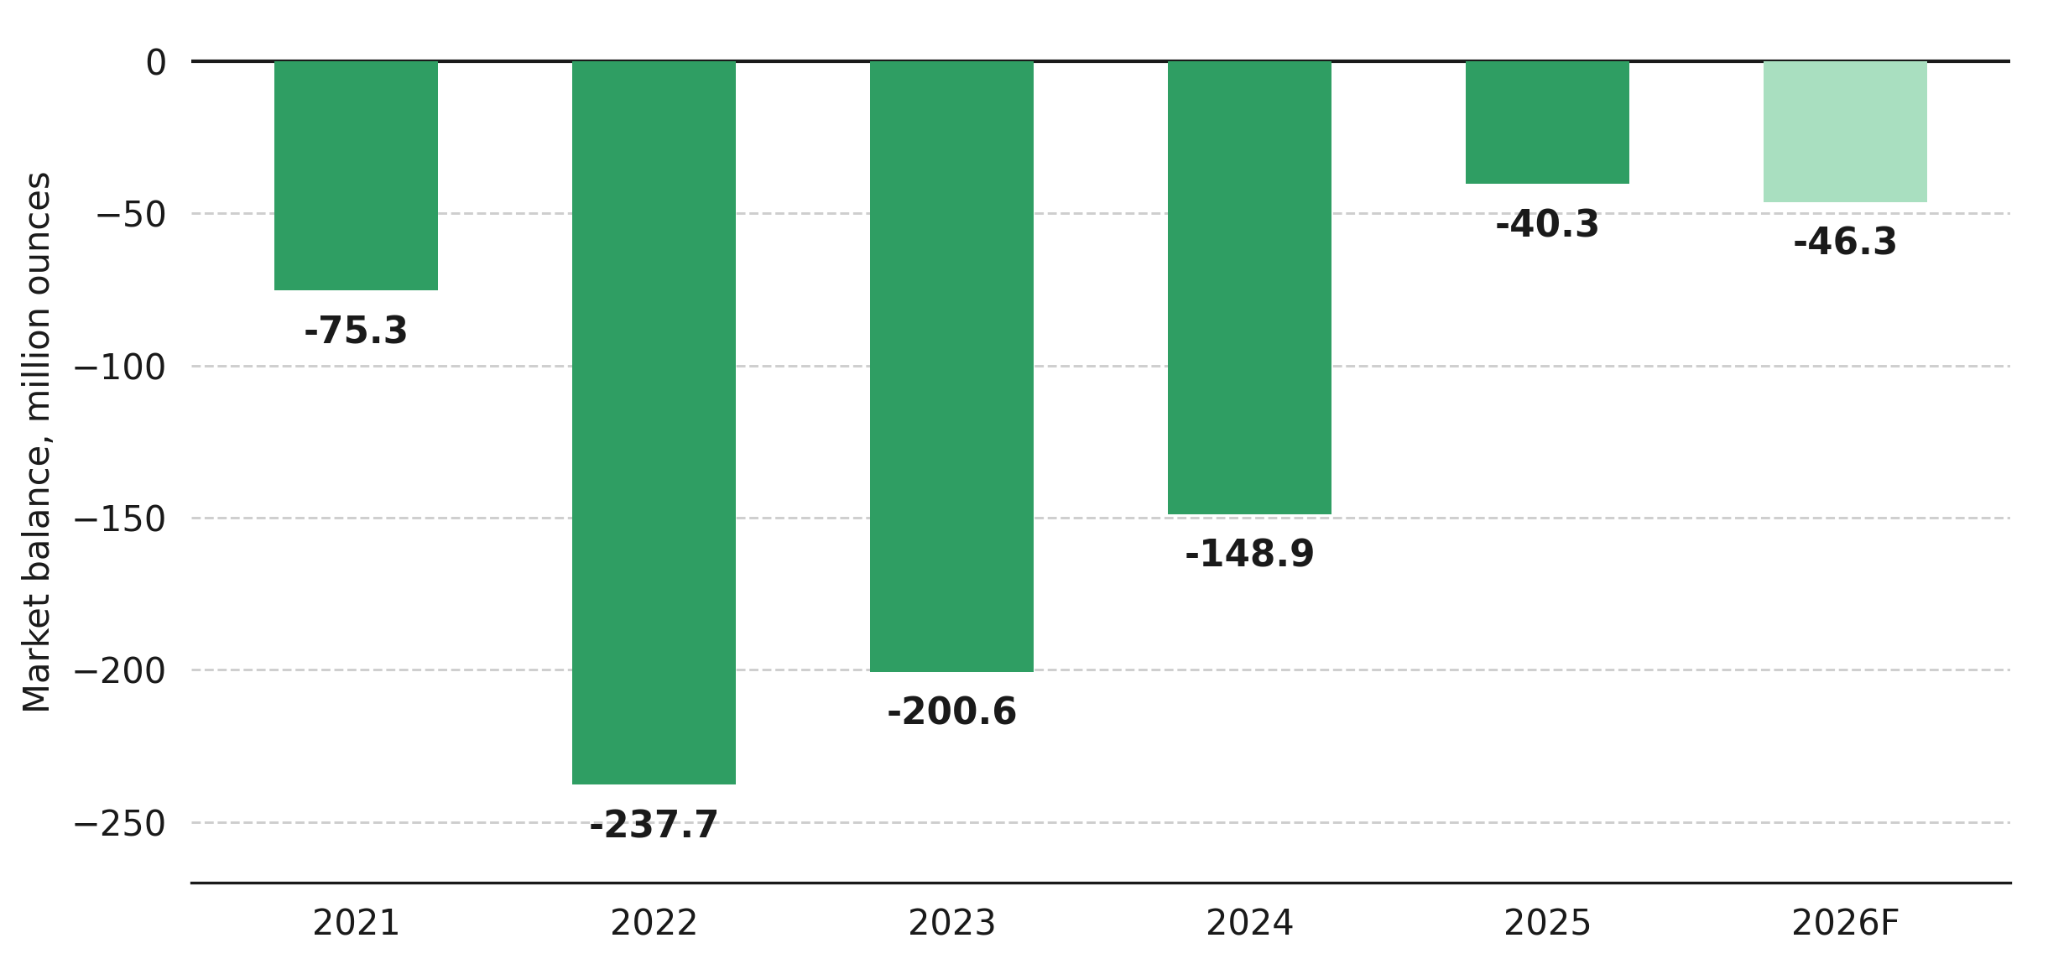
The Silver Institute's April 2026 outlook forecasts a sixth consecutive market deficit, with the 2026 shortfall estimated at 46.3 million ounces. Yet the demand composition is less uniformly bullish than the headline deficit suggests: total demand is forecast to decline 2% to 1.11 billion ounces, and industrial demand by 3%, largely because photovoltaic manufacturers continue to reduce silver intensity or substitute with other materials. Investment demand provides an offset, with coin and net-bar demand forecast to rise 18%.
Americas Gold & Silver produced 664,971 ounces of silver in Q2 2026 and 1.5 million ounces during the first half. Its July 23 production release maintained 2026 guidance of 3.2 million to 3.6 million ounces at AISC of US$30-US$35/oz, with production weighted toward the second half as Galena ramps underground mining rates. Phase 2 upgrades to Galena's No. 3 Shaft increased total hoisting capacity by approximately 150%, creating a direct mechanism to increase tonnes moved and reduce fixed operating costs per tonne.
Oliver Turner, Executive Vice President of Corporate Development at Americas Gold & Silver, connects operational upgrades directly to margins:
“The more tons that you move with the same equipment, the lower your operating cost per ton, so you're expanding margins in both directions.”
Commodity Tailwinds Cannot Repair a Weak Project
Higher gold, copper, or silver prices can widen margins, increase NPV, and improve debt-service capacity, but they do not permanently overcome poor metallurgy, excessive capital intensity, unresolved permitting, weak grade reconciliation, or repeated operating failures. They can instead temporarily conceal those weaknesses because rising revenue assumptions make project sensitivity tables appear stronger before the underlying execution probability changes.
The reverse creates the contrarian opportunity. A technically robust project may trade below peer EV/oz or below a reasonable proportion of study NPV because the commodity is out of favor, financing markets are closed, or investors are assigning a high probability to a specific unresolved risk. The potential re-rating occurs when a measurable catalyst changes that probability through a permit, feasibility study, financing package, resource conversion, construction milestone or demonstrated operating improvement.
Environmental, social and governance scores can support institutional screening by summarizing governance, environmental and stakeholder factors, but an aggregate ESG score does not substitute for project-specific evidence. Investors still need to assess permitting windows, Indigenous or community agreements, water and power availability, tailings design, closure liabilities and management's record of meeting development schedules.
The Investment Thesis for Commodity-Driven Mining Re-Ratings
- The case for gold, copper, and silver exposure in 2026 rests on genuinely different fundamentals for each metal, and investors should size conviction accordingly rather than treating "mining equities" as a single trade.
- Central bank demand provides a durable floor, but softening ETF flows mean the metal-price tailwind is not being uniformly rewarded in equities; investors should favor exposure where a rising price is compounding with a genuine reduction in project uncertainty.
- A 25% projected supply deficit by 2035 stems from long permitting timelines and a thin development pipeline, and it cannot be quickly reversed. This favors patient exposure to projects with credible paths to financing and construction, since scarcity value only accrues to supply that actually gets built.
- With industrial demand softening even as the deficit persists, silver's price support is increasingly an investment-demand story, which makes operating leverage a larger swing factor in equity returns than the commodity balance alone.
- A widening gap between spot price and quoted capital costs, or between headline deficit and reported margins, signals a need to look more closely at execution. Commodity strength expands the range of possible outcomes; it does not narrow the probability of any single one.
Gold demand, copper supply constraints and persistent silver deficits provide a supportive backdrop for mining assets in 2026, but the commodity cycle determines only the size of the potential prize. The probability of shareholders capturing that value remains a function of geology, recoveries, permitting, capital intensity, financing and execution.
For investors, the more useful question is therefore not simply which commodity rises next. It is where improving commodity fundamentals intersect with a project-specific milestone capable of changing the market's estimate of future cash flow or the probability that cash flow will be delivered.
Part 5 will discuss how management track record, near-term catalysts, and relative valuation combine to signal when the market has mispriced a project and how investors can position ahead of, rather than after, that repricing.
Read more:
What Makes a Mining Project Truly Valuable
Why Do Junior Mining Companies Become Undervalued
Why Do Contrarian Investors Outperform
TL;DR
Gold demand hit a record US$380 billion in H1 2026, but central bank buying and ETF selling are pulling in opposite directions, proof that a strong metal price doesn't make every gold equity a buy. Copper faces a 25% supply deficit by 2035 that only financeable, buildable projects can capture. Silver's sixth consecutive annual deficit masks softening industrial demand, with investment buying doing more of the work. Across all three metals, rising prices can flatter a weak project's numbers before its real risks - metallurgy, permitting, capital intensity - have actually changed. The re-rating opportunity sits where improving commodity fundamentals meet a specific, measurable de-risking event: a resource update, a feasibility study, a permit, or a construction milestone.
FAQs (AI-Generated)
Analyst's Notes





Subscribe to Our Channel










.jpg)



.jpg)





Stay Informed